Dive into the detail.
Makerble Case Management & Impact Analysis software shows you people’s journeys through your programmes so you can intervene early, produce report quickly and and do more of what works.
Find out what Makerble can do for you by taking a look at the features below.
Programme Workspace
No more jumping between spreadsheets and different systems. Manage your programme directly on Makerble for a stress-free experience.
-
Keep your delivery team on the same page with a shared view of every participant and stakeholder.
Powerful Filters: quickly sort through participants using your choice of criteria
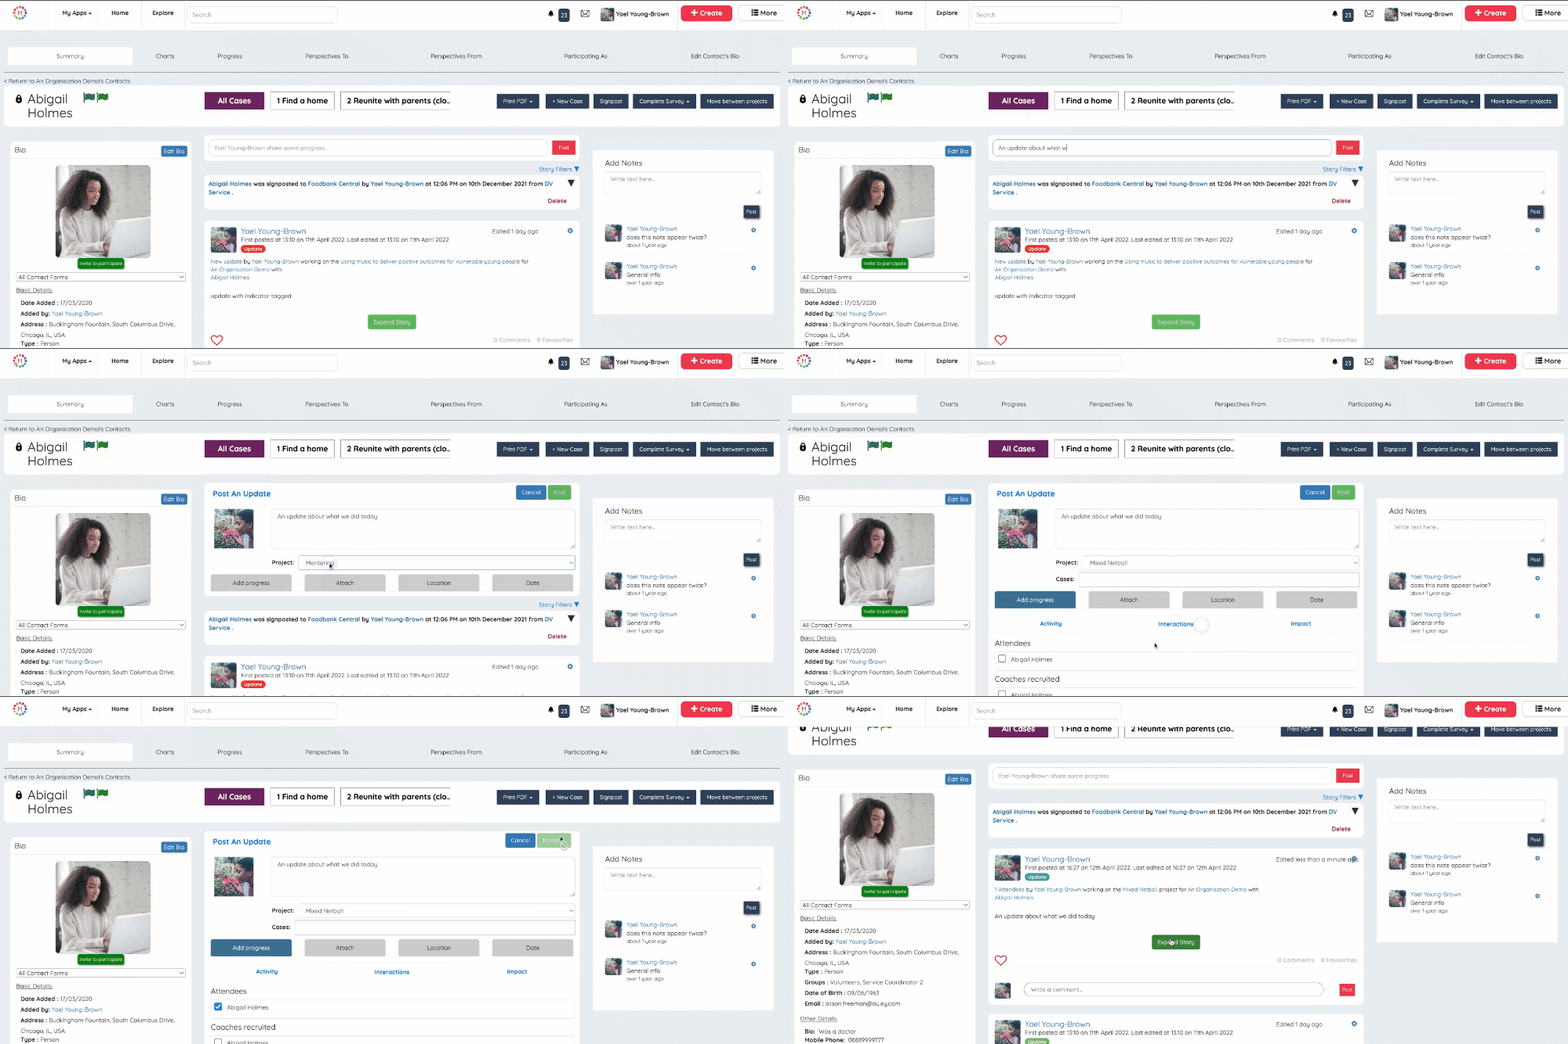
Timelines: see each participant’s engagement, survey responses and communication in one place
Forms: create your own registration forms and completion forms that can be completed by participants themselves and/or by signed-in-users
-
Subdivide your work with each participant into one or more cases
Caseload: See the caseload of each caseworker
Case file: See a shared view of the work done to support a participant by multiple colleagues working on a single case
Reporting: See the time spent on each case, by each caseworker or across each programme
-
Organise your work in the way that suits you by creating projects
Create a ‘project’ for each programme, service or campaign - depending on how you define your work
Add participants to multiple projects
See the number of participants on each project’s Waiting List and at each stage of your process
-
Keep everything on track with a shared calendar that shows every live session, workshop and 1:1 being delivered across your programmes
Recurring Events
Scheduling Assistant
Attendance Reports
-
Create a shared action plan for each participant. Outline the tasks for them to do and for your delivery team.
Automate task reminders
Delegate tasks
Get notified of completed tasks
-
Keep participants informed and engaged with two-way messaging via SMS and Email
Scheduled Messages: plan communications ahead of time to be sent out automatically
Conversations: see a shared view of your organisation’s conversation history with each participant
-
Get notified when participant engagement begins to fall, when outcomes are at risk of not being achieved or whenever key successes are achieved.
-
Use the Makerble Android app to access your participant records when you are out in the field without an internet connection.
Save participant records to your device
Access every participant’s timeline while your device is offline. Read case notes and survey responses.
Manage your caseload while offline with a dedicated Caseload page
Reporting
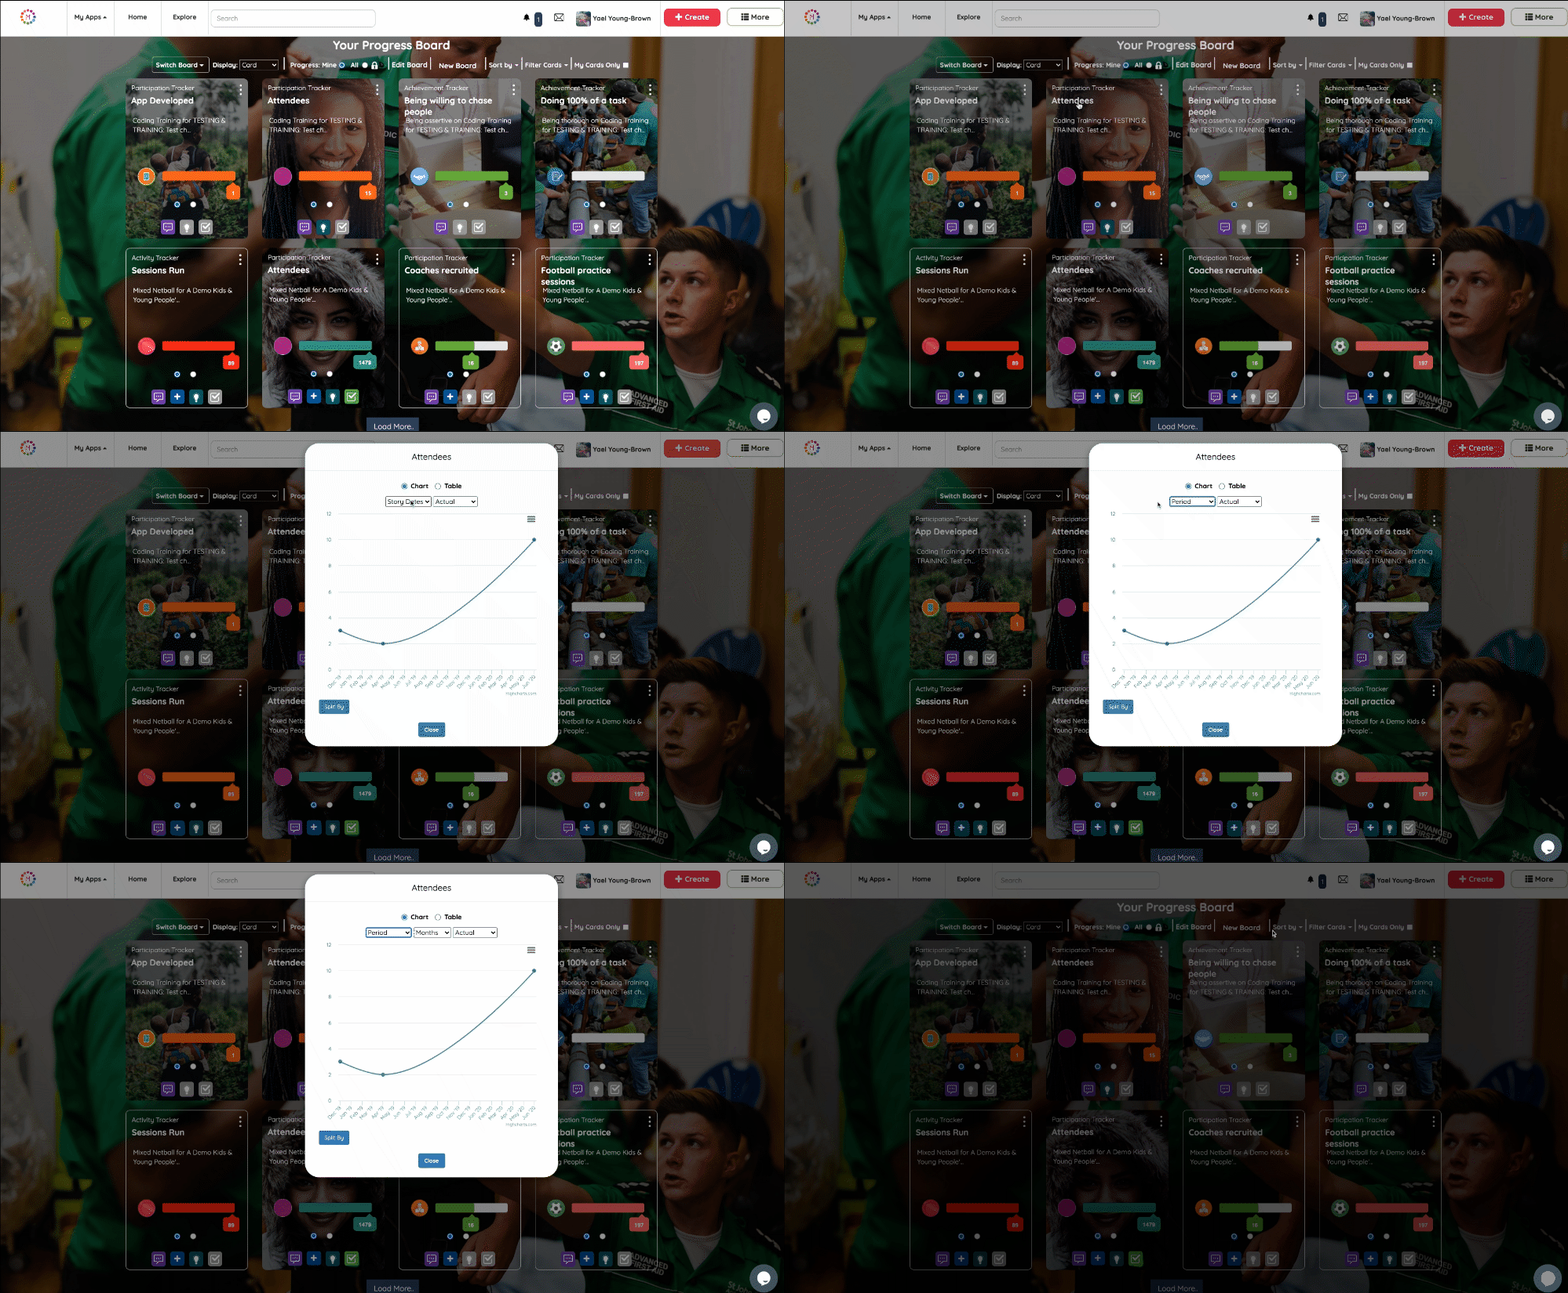
See at a glance how participants progress through your programmes, and easily navigate to reports to dive deeper.
-
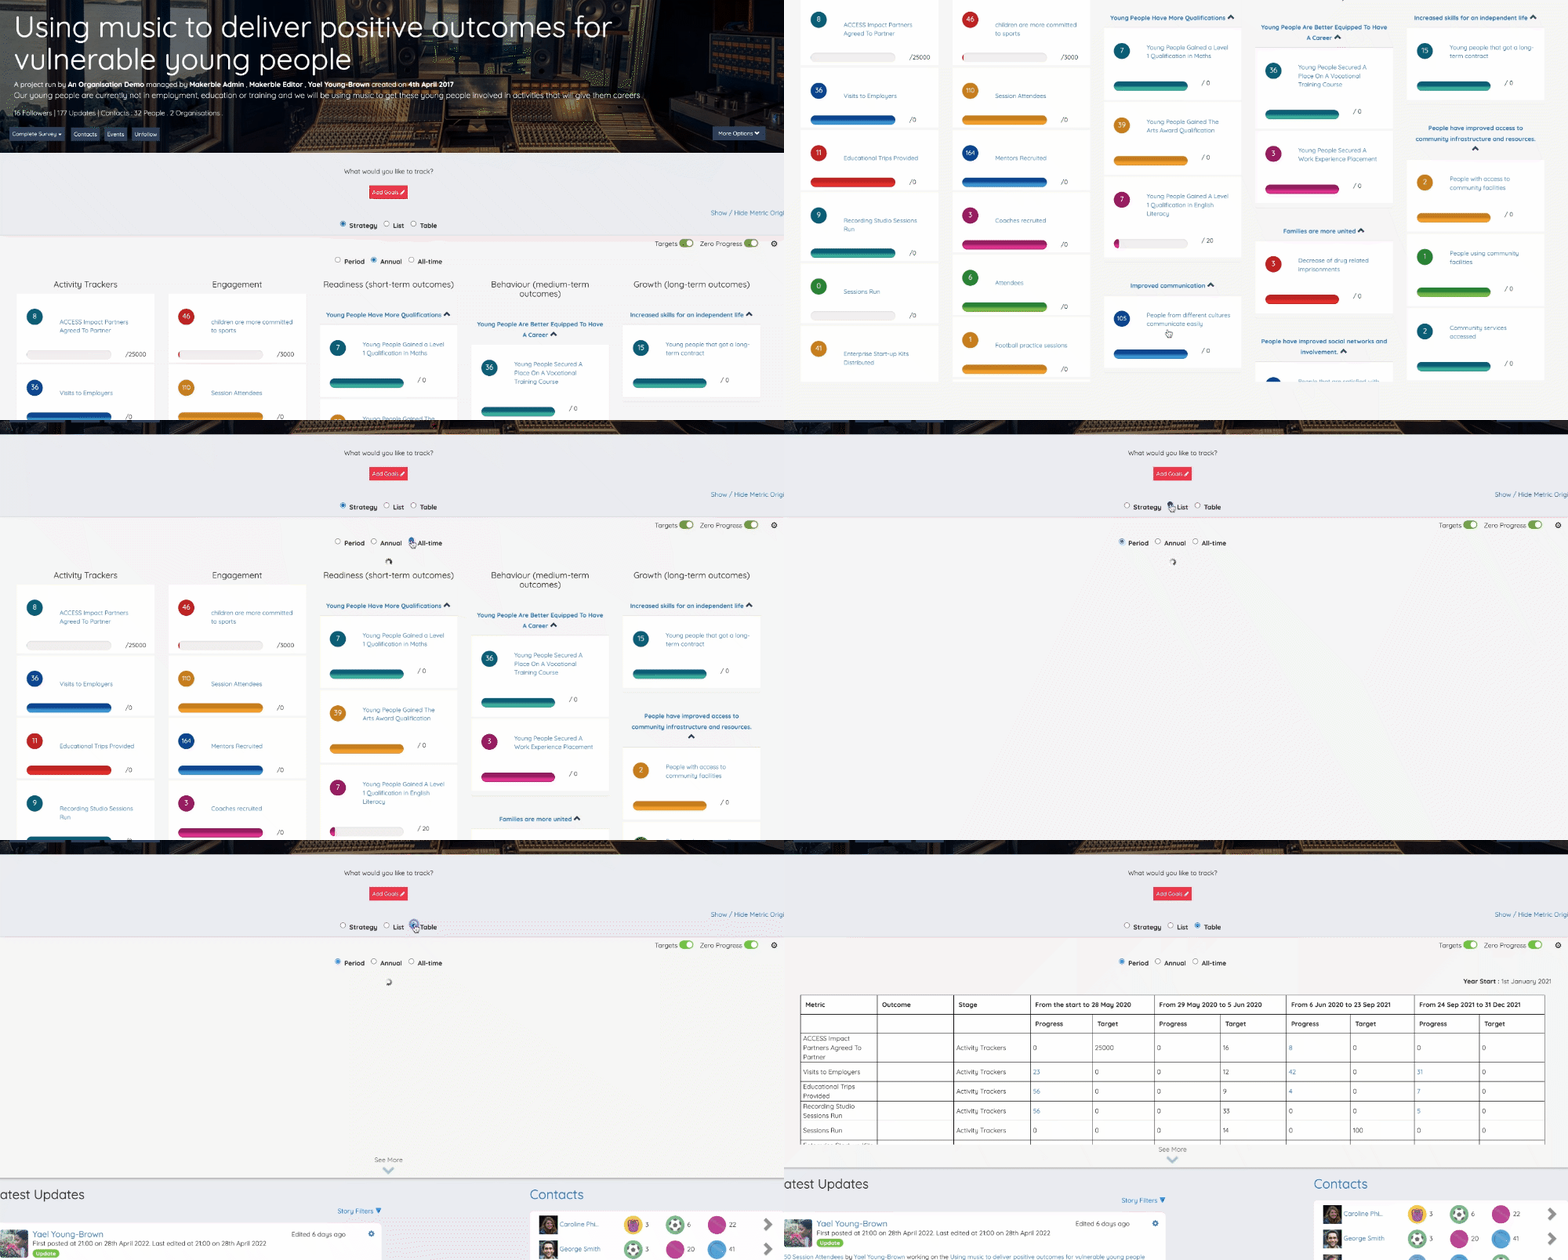
Monitor operations, engagement and impact across your programme, as it happens.
Custom Tables: choose the KPIs you want to see
Milestones & Targets: set targets with deadlines and report progress by week, month, quarter or any other time interval
-
See the impact of every programme however you define it
Growth: track KPIs that let you know whether your programme is delivering the results you need
Behaviour Change: track the extent to which participants adopt the new habits and ways of working
Attitude Change: understand how your programmes are changing the way participants think
Health, Wellbeing and more: measure the effect your programmes have on participants’ lives, families and communities
-
Quickly group specific metrics into Boards that give you the data you need for specific funders, investors, partners and senior leadership teams
Read-only access: allow people to view data but not post updates
Share reports directly with specific stakeholders
-
Track the work being done by your teams delivering each programme:
Classes, workshops and sessions: scheduled, delivered and cancelled
Caseload per staff member, programme or department
-
Understand how time is being spent, by whom and doing what, across the different activities within your programme.
Report per specific Role
Report per programme
Report perstaff member
Report per participant
-
See a snapshot of the progress being made towards your programme’s strategy:
Organise activity, outputs, outcomes and indicators into your own framework, logic model or theory of change
Save logic models as templates that can be reused across multiple programmes
-
See your impact in context using maps.
See your data broken down at a ward, town, county, region, country or continent level.
Use powerful intuitive filters to further segment your data by any attribute in the platform
Data Collection and Management
Collect, organise and manage your data easily with a variety of built-in tools and integrations with Google Calendar, Google Drive, Gmail and more.
-
Understand how every participant improves over time against every metric you care about
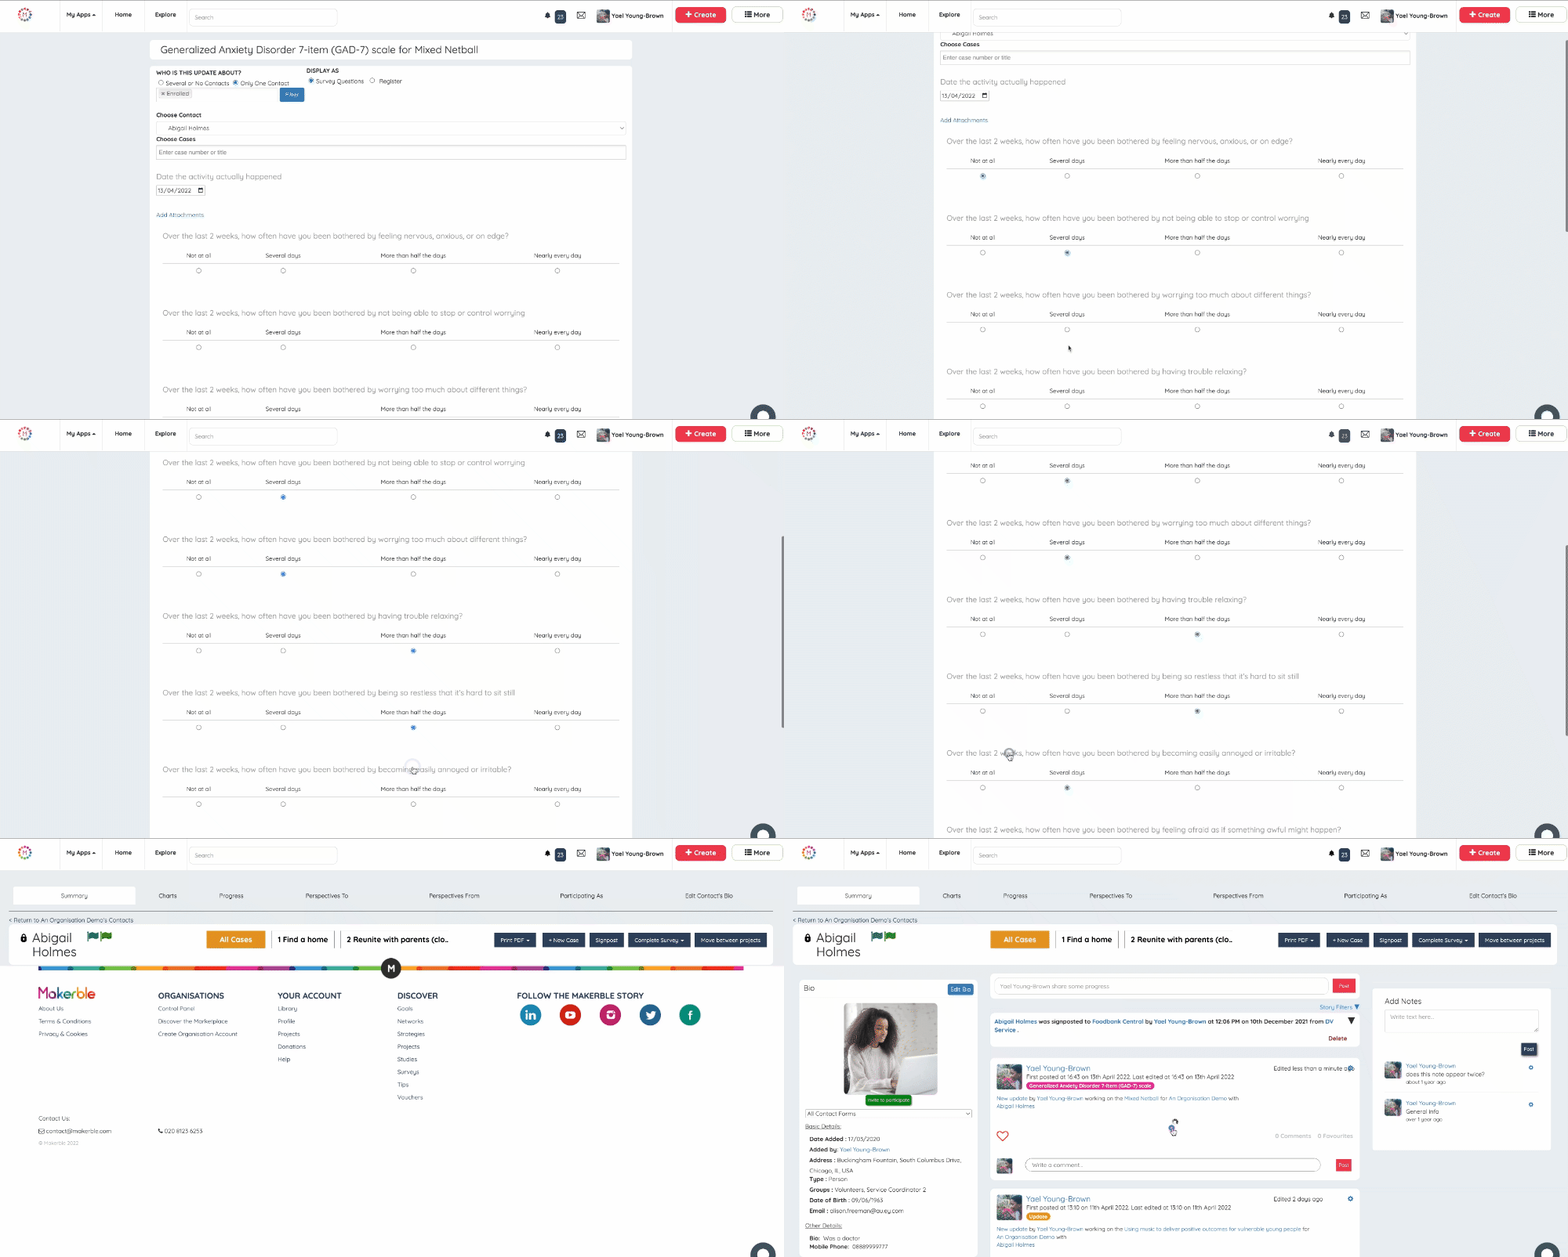
Distance Travelled: automatically calculate Distance Travelled at a question and survey-wide level for every participant and programme as a whole.
Flexible Anonymity: Decide whether you want responses to be identifiably linked to each participant, intelligently anonymised or completely anonymous:
Multiple Deployment Methods: Whether you want to share a generic link to your survey, Email a unique link to each participant or combine both methods and use SMS instead, you can deploy surveys in whichever way works for your programme.
Survey Templates: save time by starting with template surveys you can add to your programme in a couple of taps
Questions Library: write your own questions and find them again quickly when you want to use them in another survey
-
Understand the nuance of what’s happening on your programme by capturing everything from observations to anecdotes.
Rich content: add pictures, videos, audio clips and file attachments
Geolocation: add the location where activity took place to enable geographic reporting
-
Collect and store progress towards any KPI.
KPI Builder: Create and track your own custom KPIs, outputs, outcomes and impacts
Template KPIs: Save time by starting off with a template of KPIs
Automatic aggregation: Tag KPIs to individual participants and see the total progress at a programme or organisation-wide level
-
Import datasets into Makerble as CSV files
Import progress towards KPIs that is tagged to individual participants
Import aggregate progress that is not tagged to participants
Export data from Makerble as a CSV file
-
Bring data from across your organisation together
Pull data across from third-party systems into Makerble
Sync events with Google Calendar, connect contact messaging to Gmail and import files from Google Drive
Push data to other systems from within the platform using the Makerble API. E.g. Salesforce.
Our engineers are on-hand to integrate with the software tools you use.
-
Increase engagement in longitudinal research studies in which participants are repeatedly asked the same question every few hours, days, weeks, months or years.
Visual Feedback: Give every participant access to a personalised dashboard that visualises their progress towards the metrics you’ve been asking them about
Personalised Images and Emojis: Increase participant ownership of their data by inviting them to personalise their Board with images and emojis that mean something to them
Social Community: Harness the power of community to maintain engagement by optionally allowing participants to see other participants’ progress responses and react with Likes and Comments.
-
Use the Makerble Android application to continue to gather programme data even without an internet connection.
Offline registration forms to register new participants, beneficiaries and stakeholders
Offline surveys and questionnaires
Automatic sync to the cloud when the device has an active internet connection
Insights
Access, organise and visualise your data to fit your organisation’s needs. Analyse your data your way and share insights with colleagues.
-
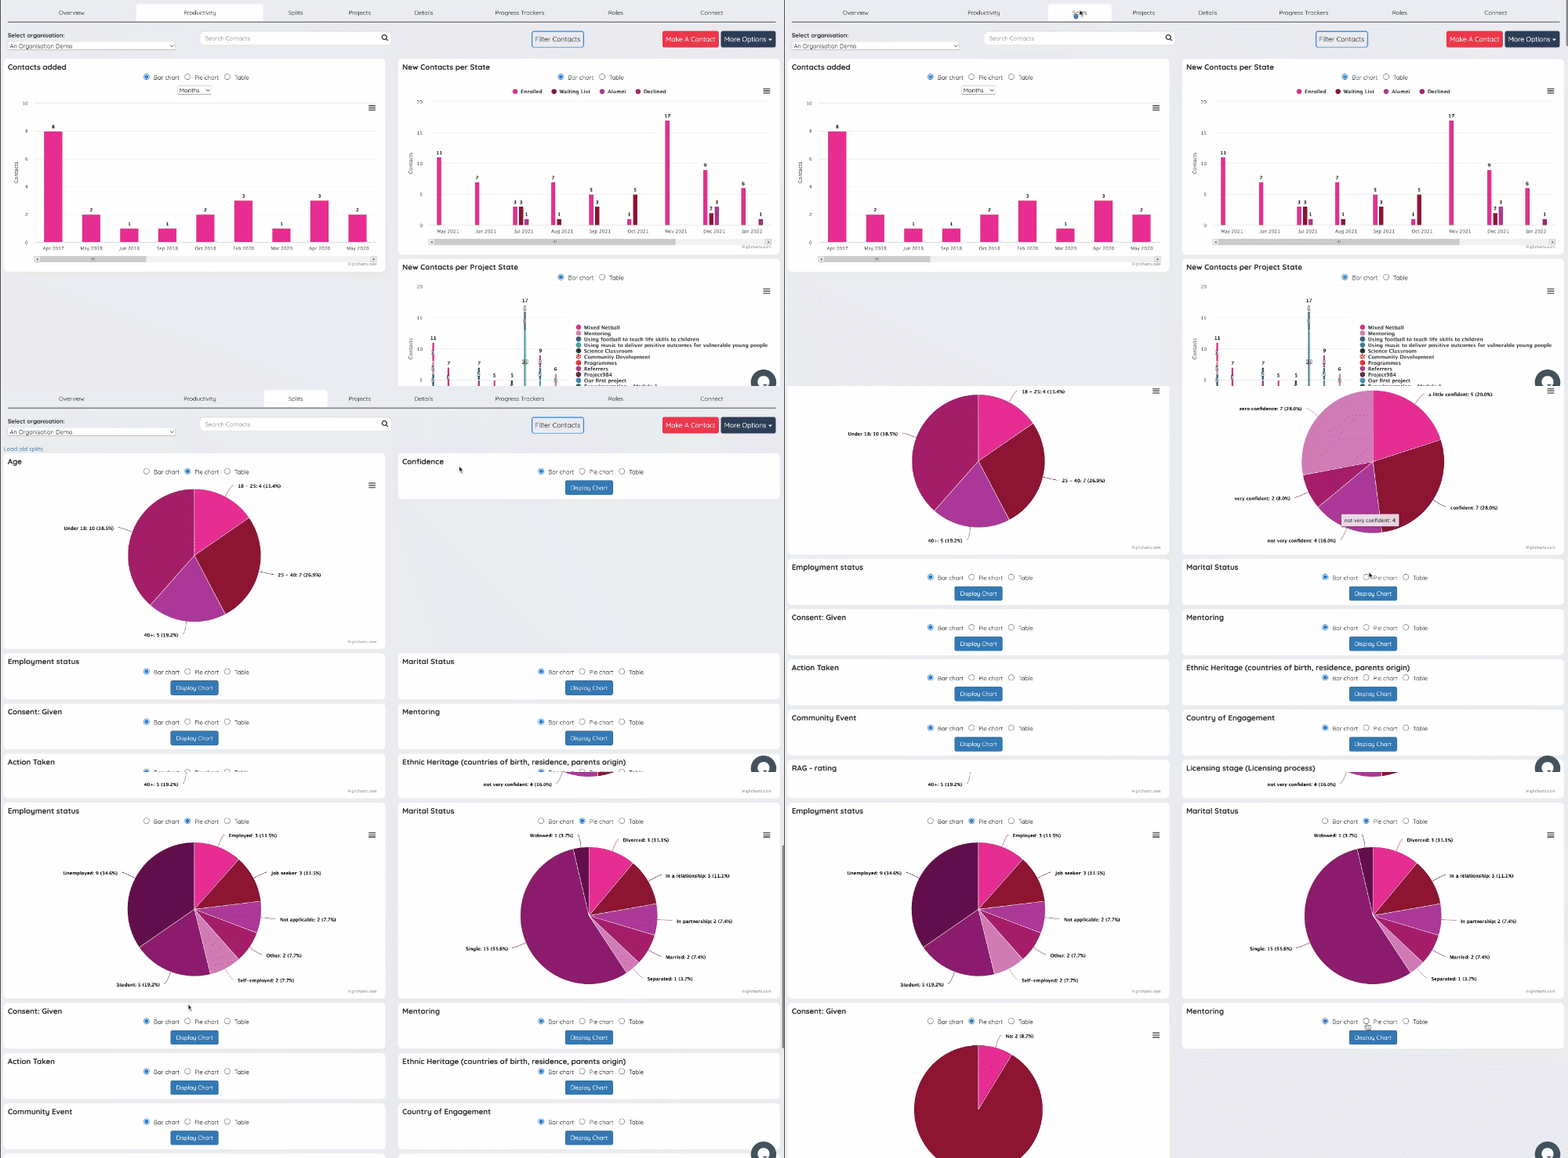
Explore your data using straightforward toggles and filters.
Split By: segment progress by combinations of participant characteristics such as age, gender and ethnicity
Deep Dives: filter results by a range of factors including participant progress, characteristics, engagement history and more
Visualisations: understand progress using radar charts, bar charts, pie charts and tables
-
Understand why your programme is delivering the results it achieves
Qualitative Coding: use Labels to group stories into themes
Organisation: quickly access the stories, anecdotes and survey responses that relate to a specific theme
-
Build your organisation memory, even as staff come and go. Store easily discoverable best practice articles in a shared repository so that colleagues and participants can access shared learning.
KPI Tags: Tag best practice articles with the outputs, outcomes, indicators and participant segments they relate to
Collections: organise best practice into thematic Collections you can publish and share
Discovery: see recently published or discussed articles in your newsfeed
Reputation: showcase the articles you’ve published and liked on your user profile
-
Book a workshop with a Makerble Expert to further unpack your data and team’s insights


