
spark agency within service users

How It Works
1. TURN INDICATORS INTO LIFESTYLE GOALS
You can describe your outcome indicators and participation outputs as lifestyle goals your service users want to work towards
Build your library of lifestyle goals. Each goal has its own icon, picture and description text


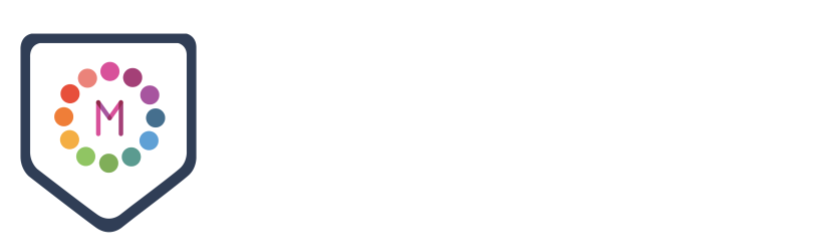
2. EACH SERVICE USER GETS THEIR OWN PERSONAL BOARD OF GOALS
Service users get their own board with the goals from your programme outcomes that are relevant to them personally
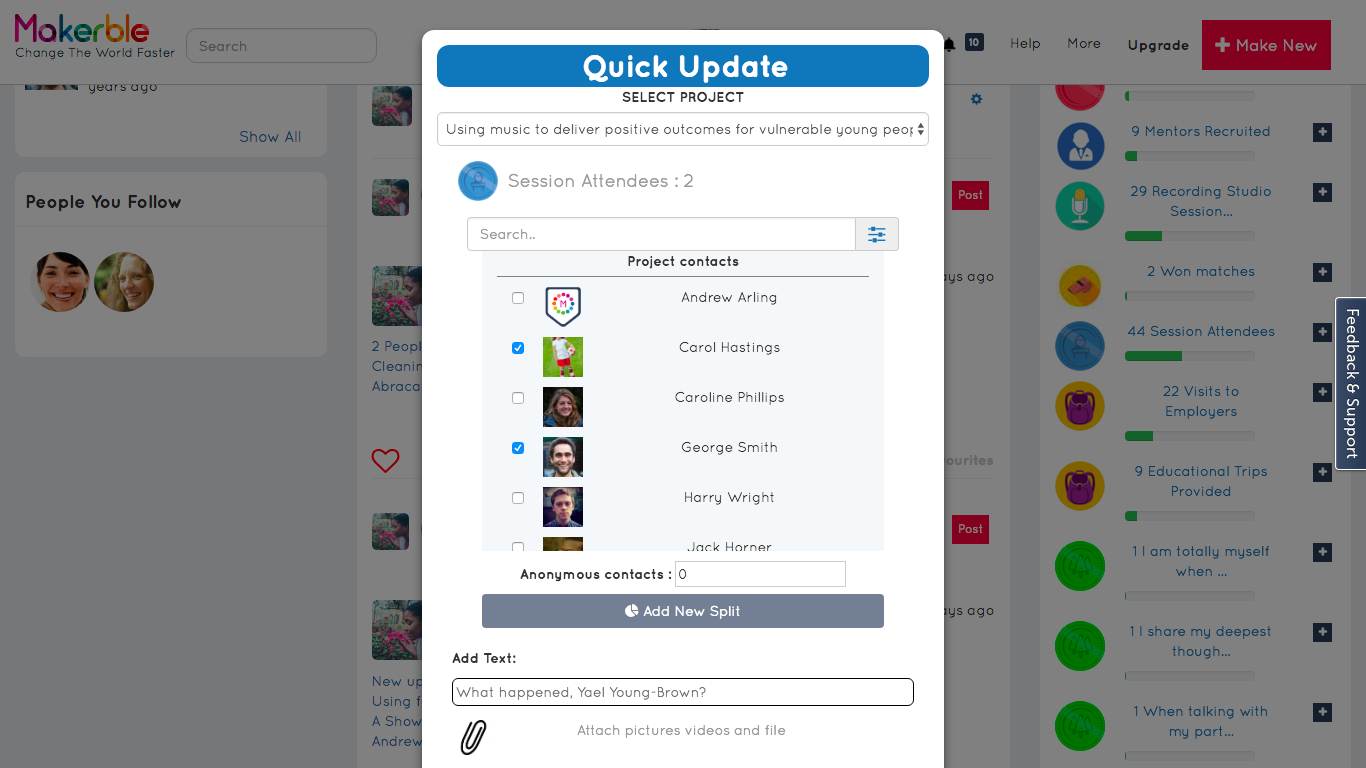
Service users can log their progress in a few taps
Service users can login with Facebook, Instagram, Twitter or with an email address
3. SERVICE USERS ARE MOTIVATED BY SEEING PROGRESS
Service users get personalised insights that show them their progress over time
You can add links to helpful articles and posts from your blog, knowledge bank and social media channels. Service users will receive notifications reminding them of these articles when their progress in that area slows down
Inspire service users to track their own progress
With demand for services showing no signs of slowing down and uptake in mobile technology continuing to rise, it is critical for nonprofits and public services to empower service users to take more ownership of the work being done to improve their lives.


Demand for services has risen in recent years and is only set to continue rising
70% of charities believed that demand for their services was set to increase over the next 12 months (PwC, Institute of Fundraising, Charity Finance Group)
A weak pound, high inflation and declining investment in the UK after Brexit is likely to leave the economy fragile (NCVO The Road Ahead 2019 / Third Sector)
Ageing populations are increasing the demand on public services (McKinsey)
New approaches are required to deliver services to an ageing population (The Oxford Institute of Population Ageing)

People are becoming increasingly obsessed with personal progress data
Quantified self makes use of many different technologies to record data from different aspects of your life. (The Futures Platform)
The last several years have marked the rise of the Internet of Things and Big Data. These trends enabled individuals to gain unprecedented insights into their own daily behaviours through self-quantification technologies, ultimately empowering them to make healthier daily decisions. (WIRED)
The potential that all this technical innovation has and the visibility and control it can give consumers when it comes to their physical health is clear – it can actually keep people alive for longer. (Trend Monitor)

3 Reasons Why Self-Reporting Is Becoming Crucial
You don’t want to leave your participants behind
Make your service more inclusive by enabling people to access a layer of support, outside of your normal working hours.
Use the data people are sharing with you to inform who you prioritise and the design of your services.

You don’t want to get left behind as an organisation
People will turn to the modes of help which are most convenient to them, whether that’s a WhatsApp Group, mobile app from a private sector company or other sources of data.
You can maintain your relevance by engaging with people in the digital manner that they find convenient.

You can create a valuable source of data for researchers
Whether your organisation is directly involved in research or not, the data you will amass through a customised Activity Tracker will provide your sector with valuable insight into the trends and patterns related to the people you work with.
3 Pillars Of Self-Reporting
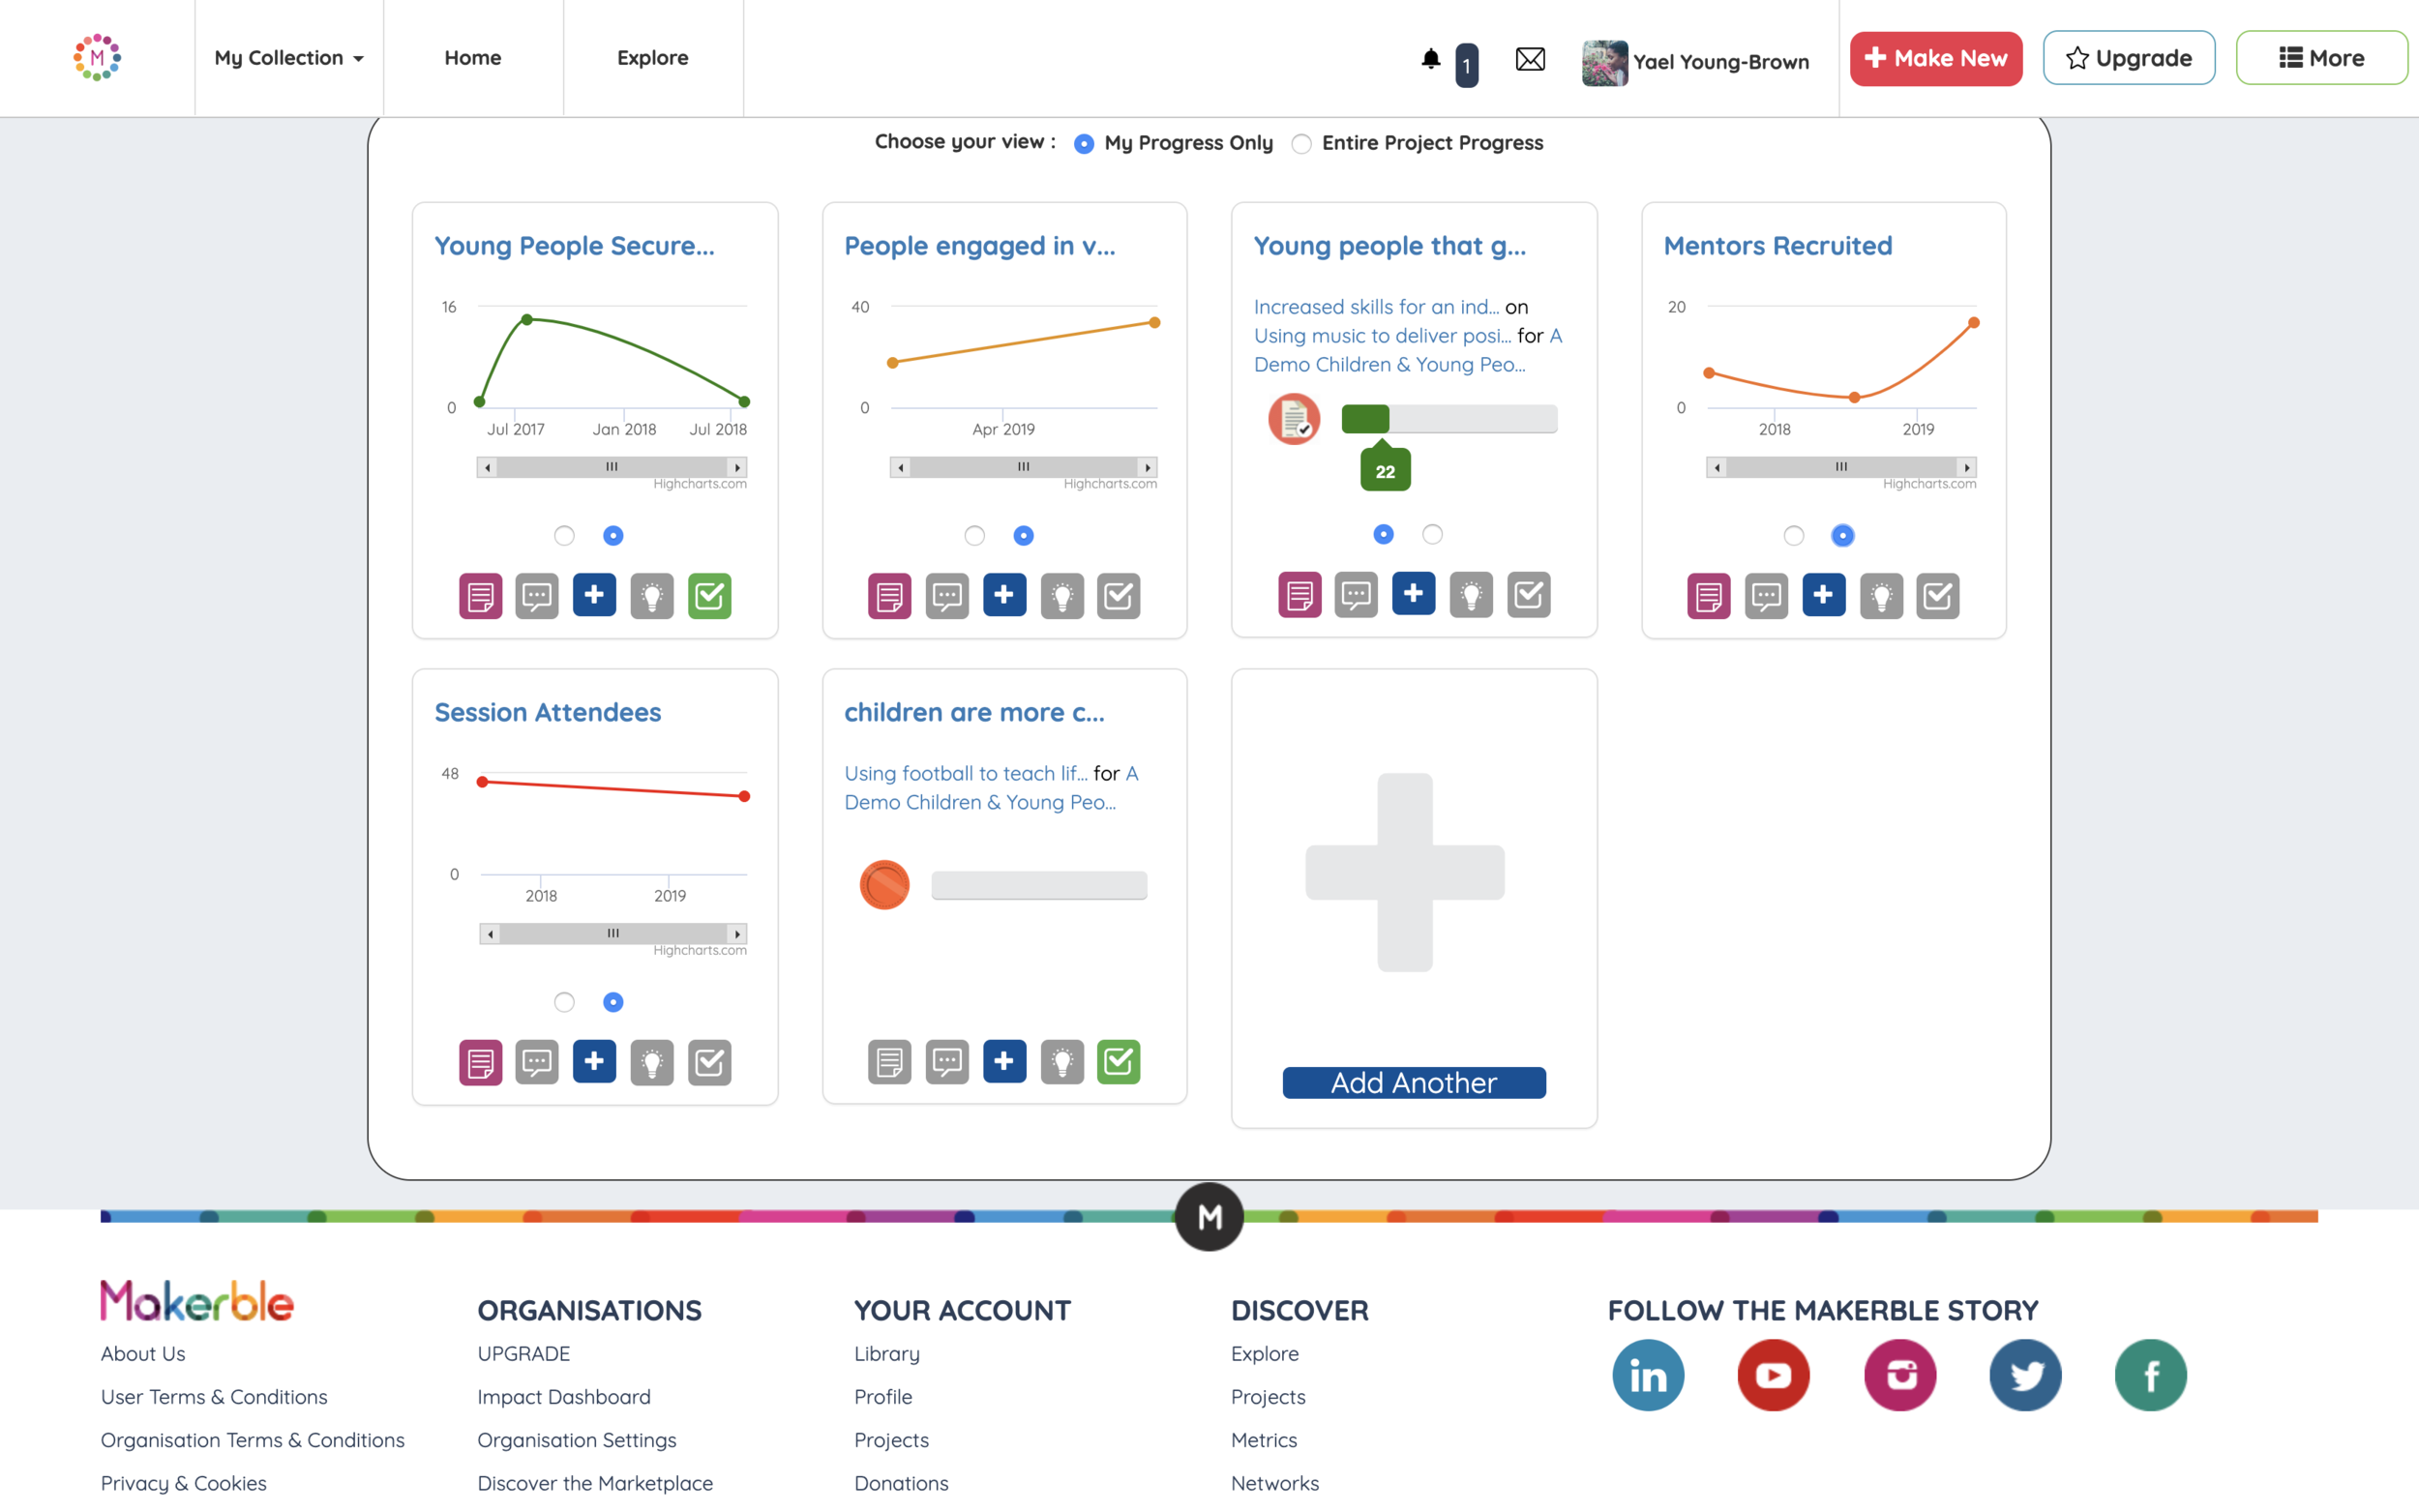
1. tAP TO UPDATE
Once you have decided what you want your service users to track, they can easily log their daily, weekly or monthly progress.
This can include numerical progress, progress along a scale, anecdotes and other content people wish to add to their journal - pictures, videos, links.

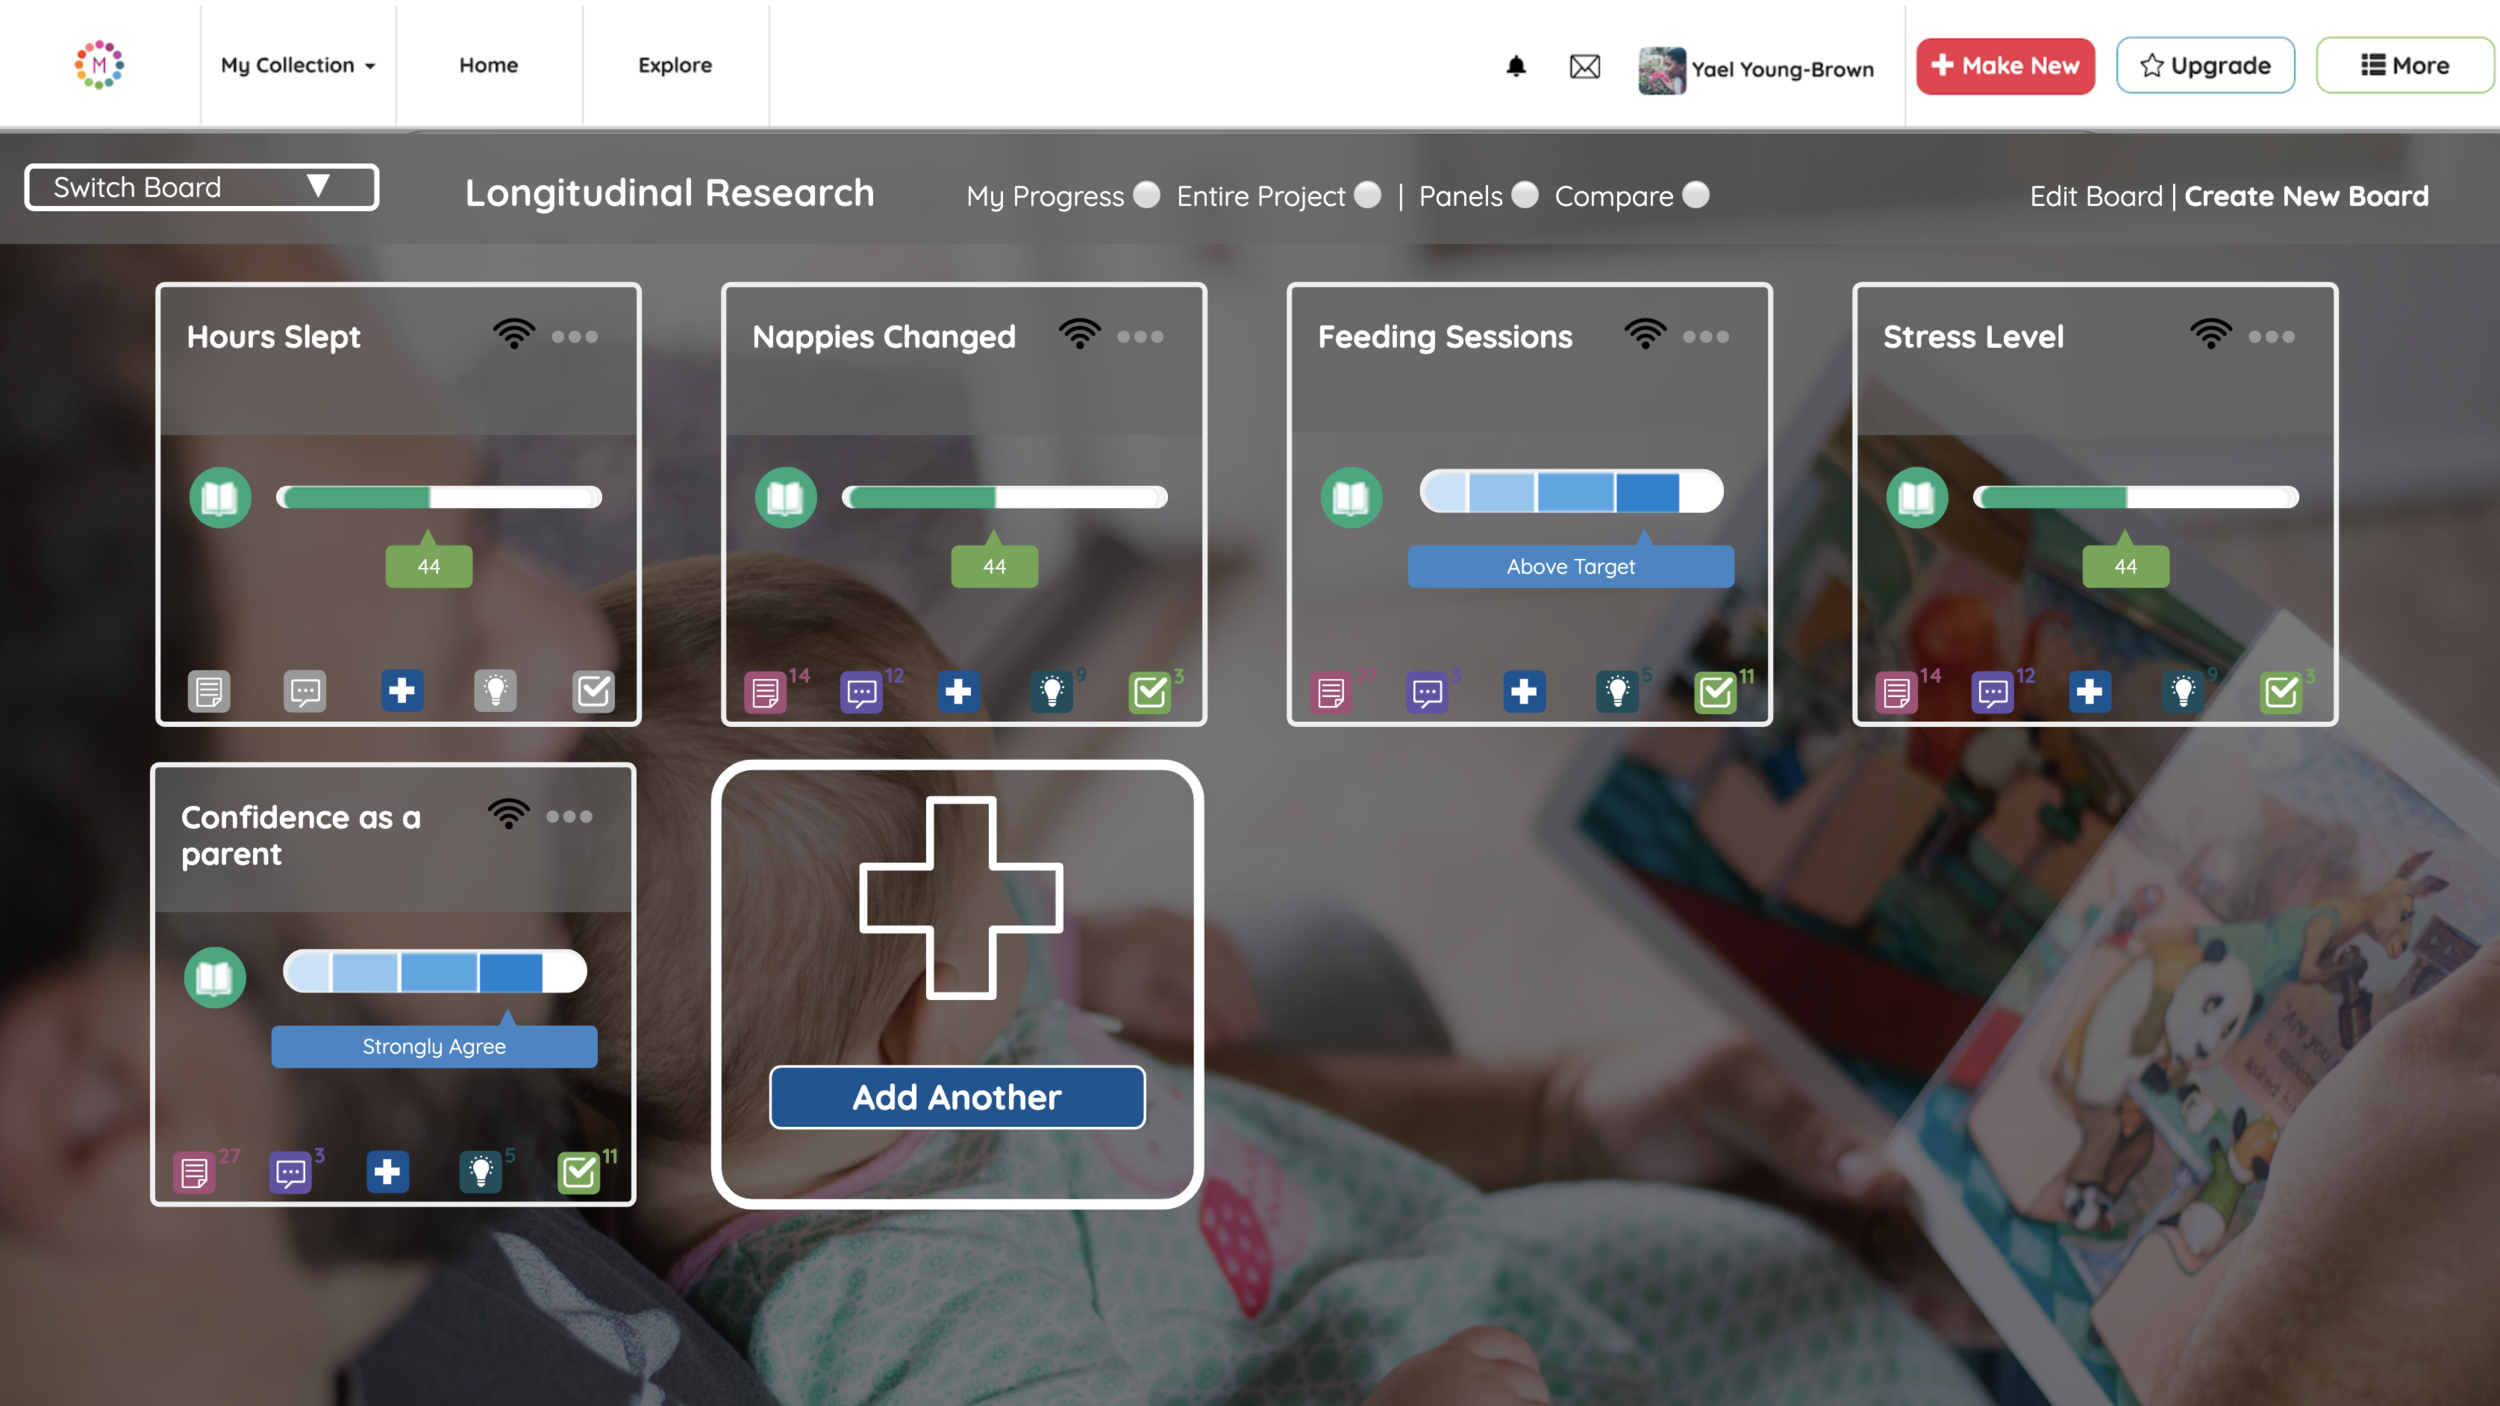
2. TIPS
Based on the progress that people have logged, you can set the algorithm to recommend certain “Tips” to your service users. These could be:
Helpful articles and videos
Suggestions and questions from other people within your community

3. TRENDS
You and your service users will see personalised progress in real-time. This will displayed with progress bars, charts and badges.
You can further analyse your data and look for trends and insights.
3 Considerations Relevant To Self-Reporting
1st CONSIDERATION
Are people happy to share their data with us?
People are willing to share their data with organisations they trust, especially when you can tell them that their anonymised data will be used by researchers to help improve things on a larger scale.
2nd CONSIDERATION
Does this mean we are scrapping our existing provision?
No. An Activity Tracker complements and actually enhances existing provision by giving you additional data with which you can personalise your service and identify which people are in the greatest need in any given moment.
3rd consideration
Can we integrate the data into our database or export it for further analysis?
Yes. If you use a database such as Salesforce which has open APIs, we can integrate the two systems so that your staff can still use your existing database to manage service users.
Getting Started

Contact Matt Kepple, Chief Executive at Makerble, to arrange an exploratory call or meeting. Matt has worked with charities, government departments, social enterprises, brands and advertising agencies to generate ideas which impact people’s lives.
Email: [email protected] Phone: +44 (0) 7950 421 815