
Prove the impact you make on local communities
We provide beautifully intuitive software for Housing Associations and organisations working in Community Development
Call us on 020 8123 6253 to speak to a consultant now
Do you struggle to article the impact your programmes make on the communities you serve?
Do you manually calculate your Social Value?
Do you have a variety of systems, spreadsheets and processes for keeping track of the residents that engage in your Community Investment programmes
Could you do more to share best practice around how to achieve Value For Money on the programmes you run?

Features
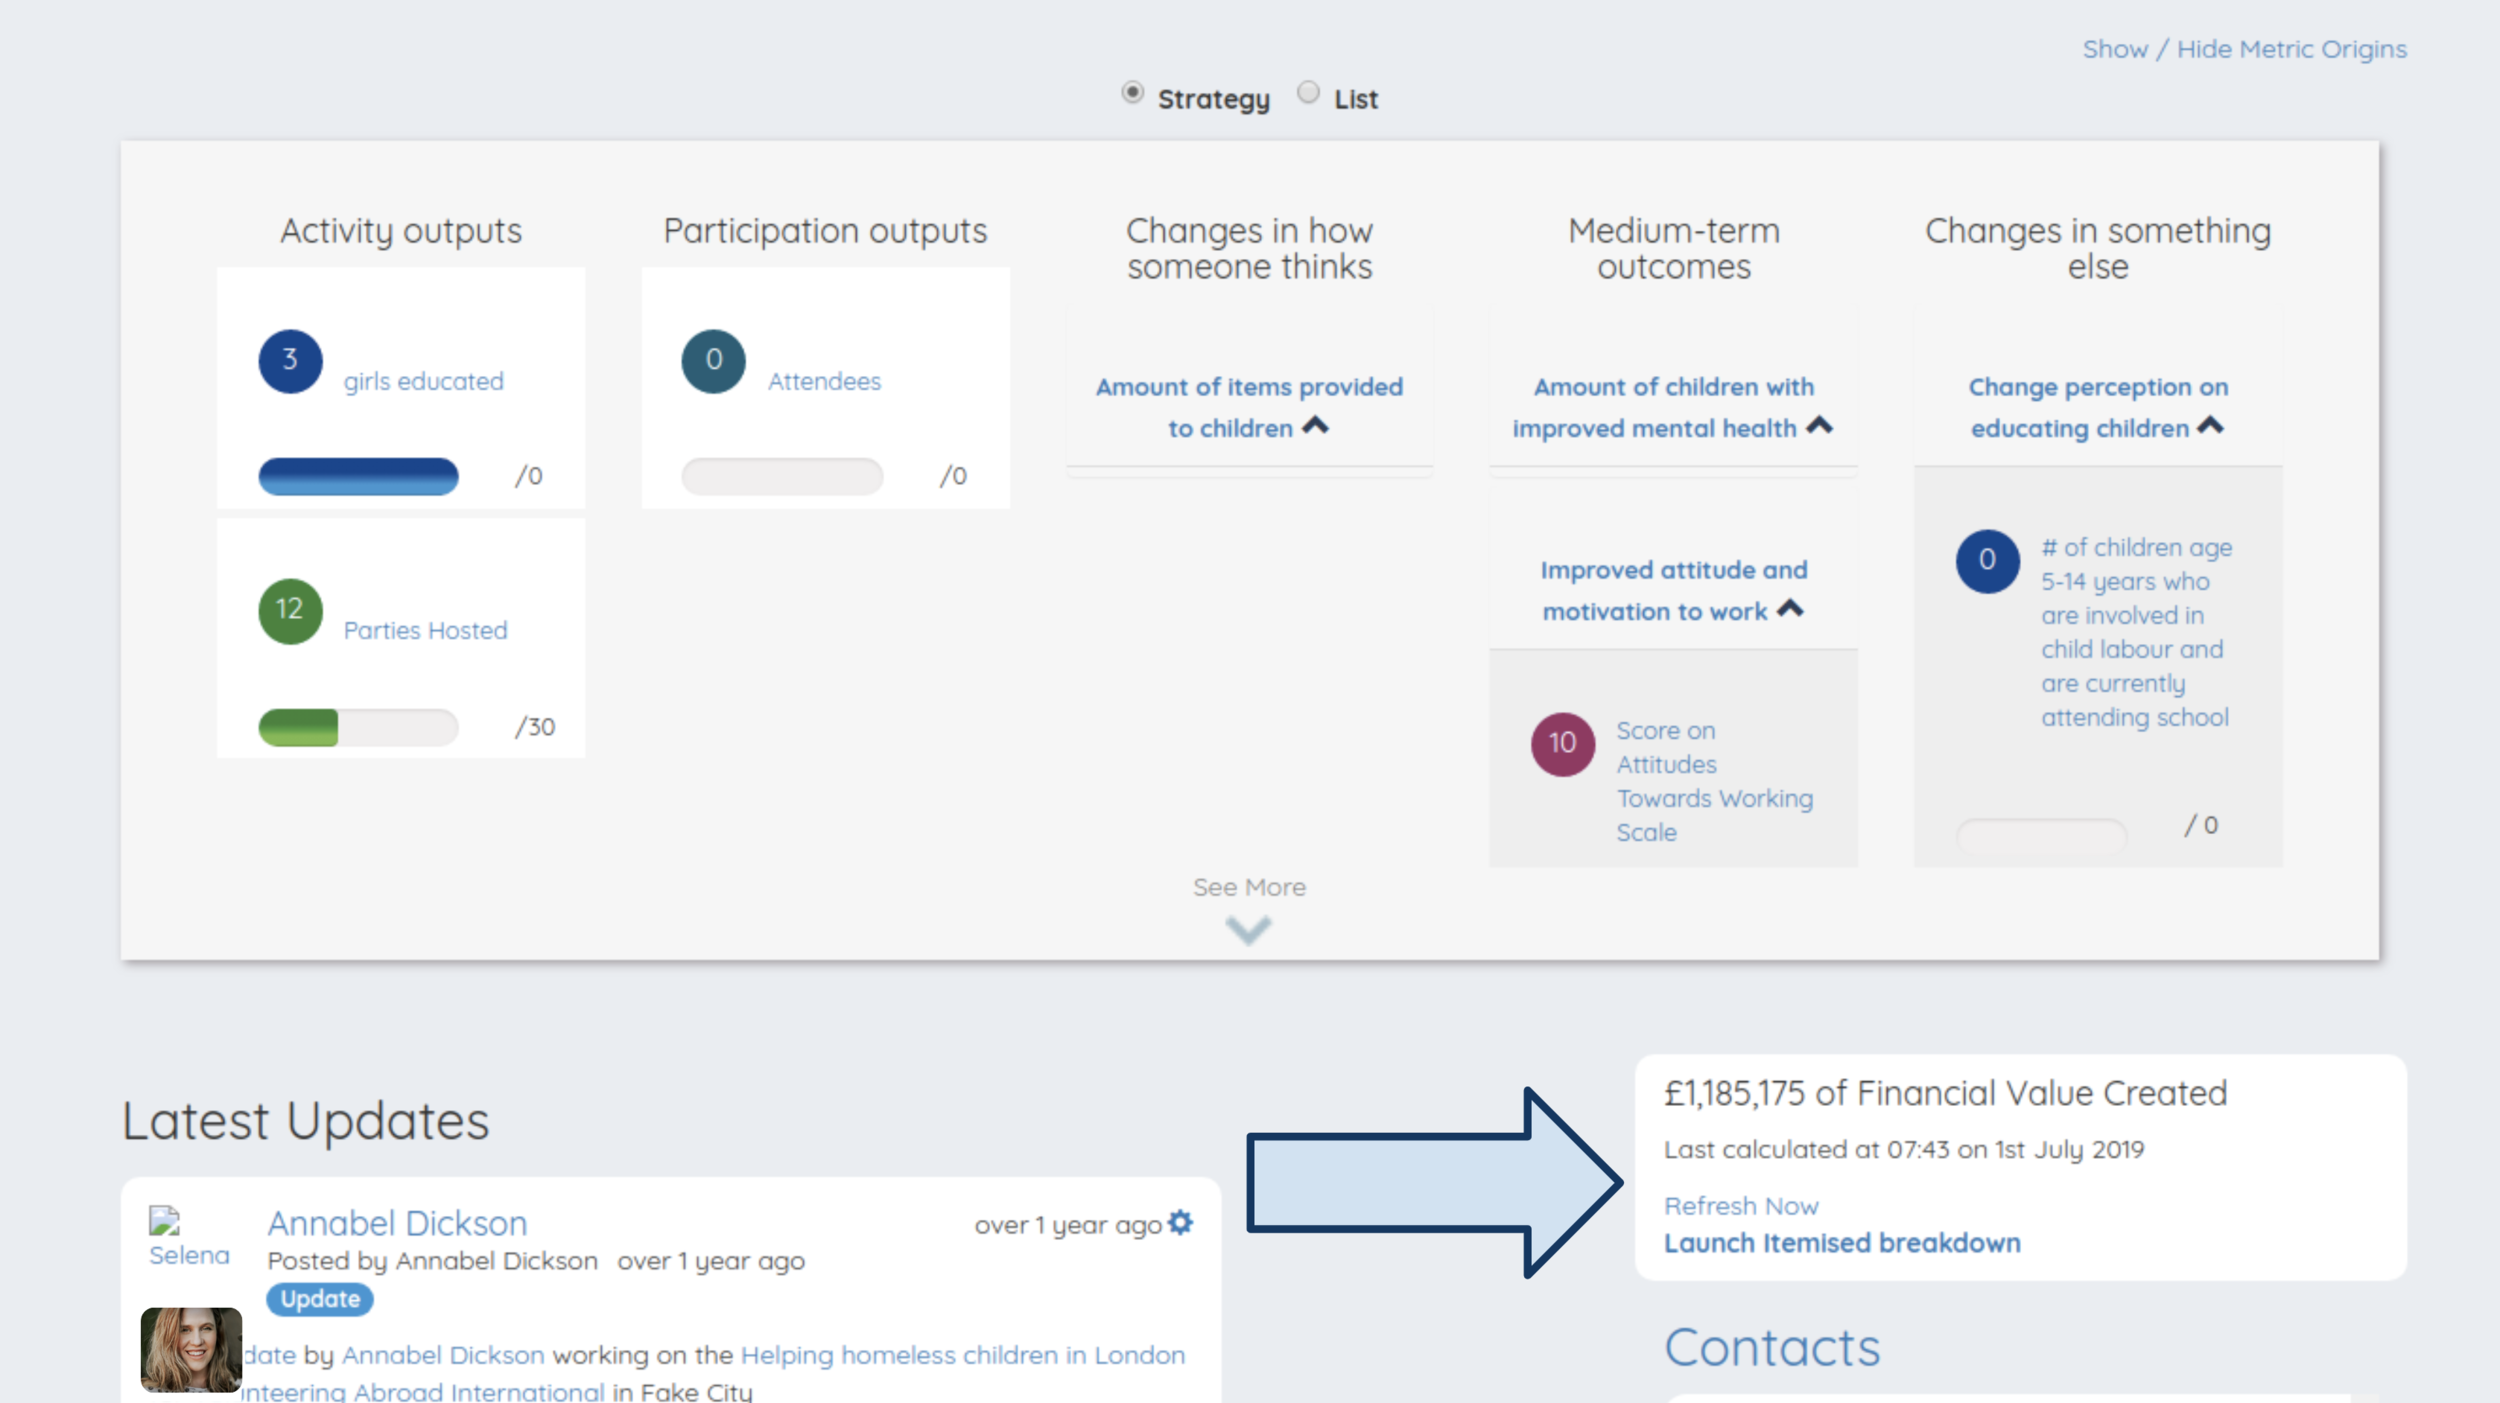
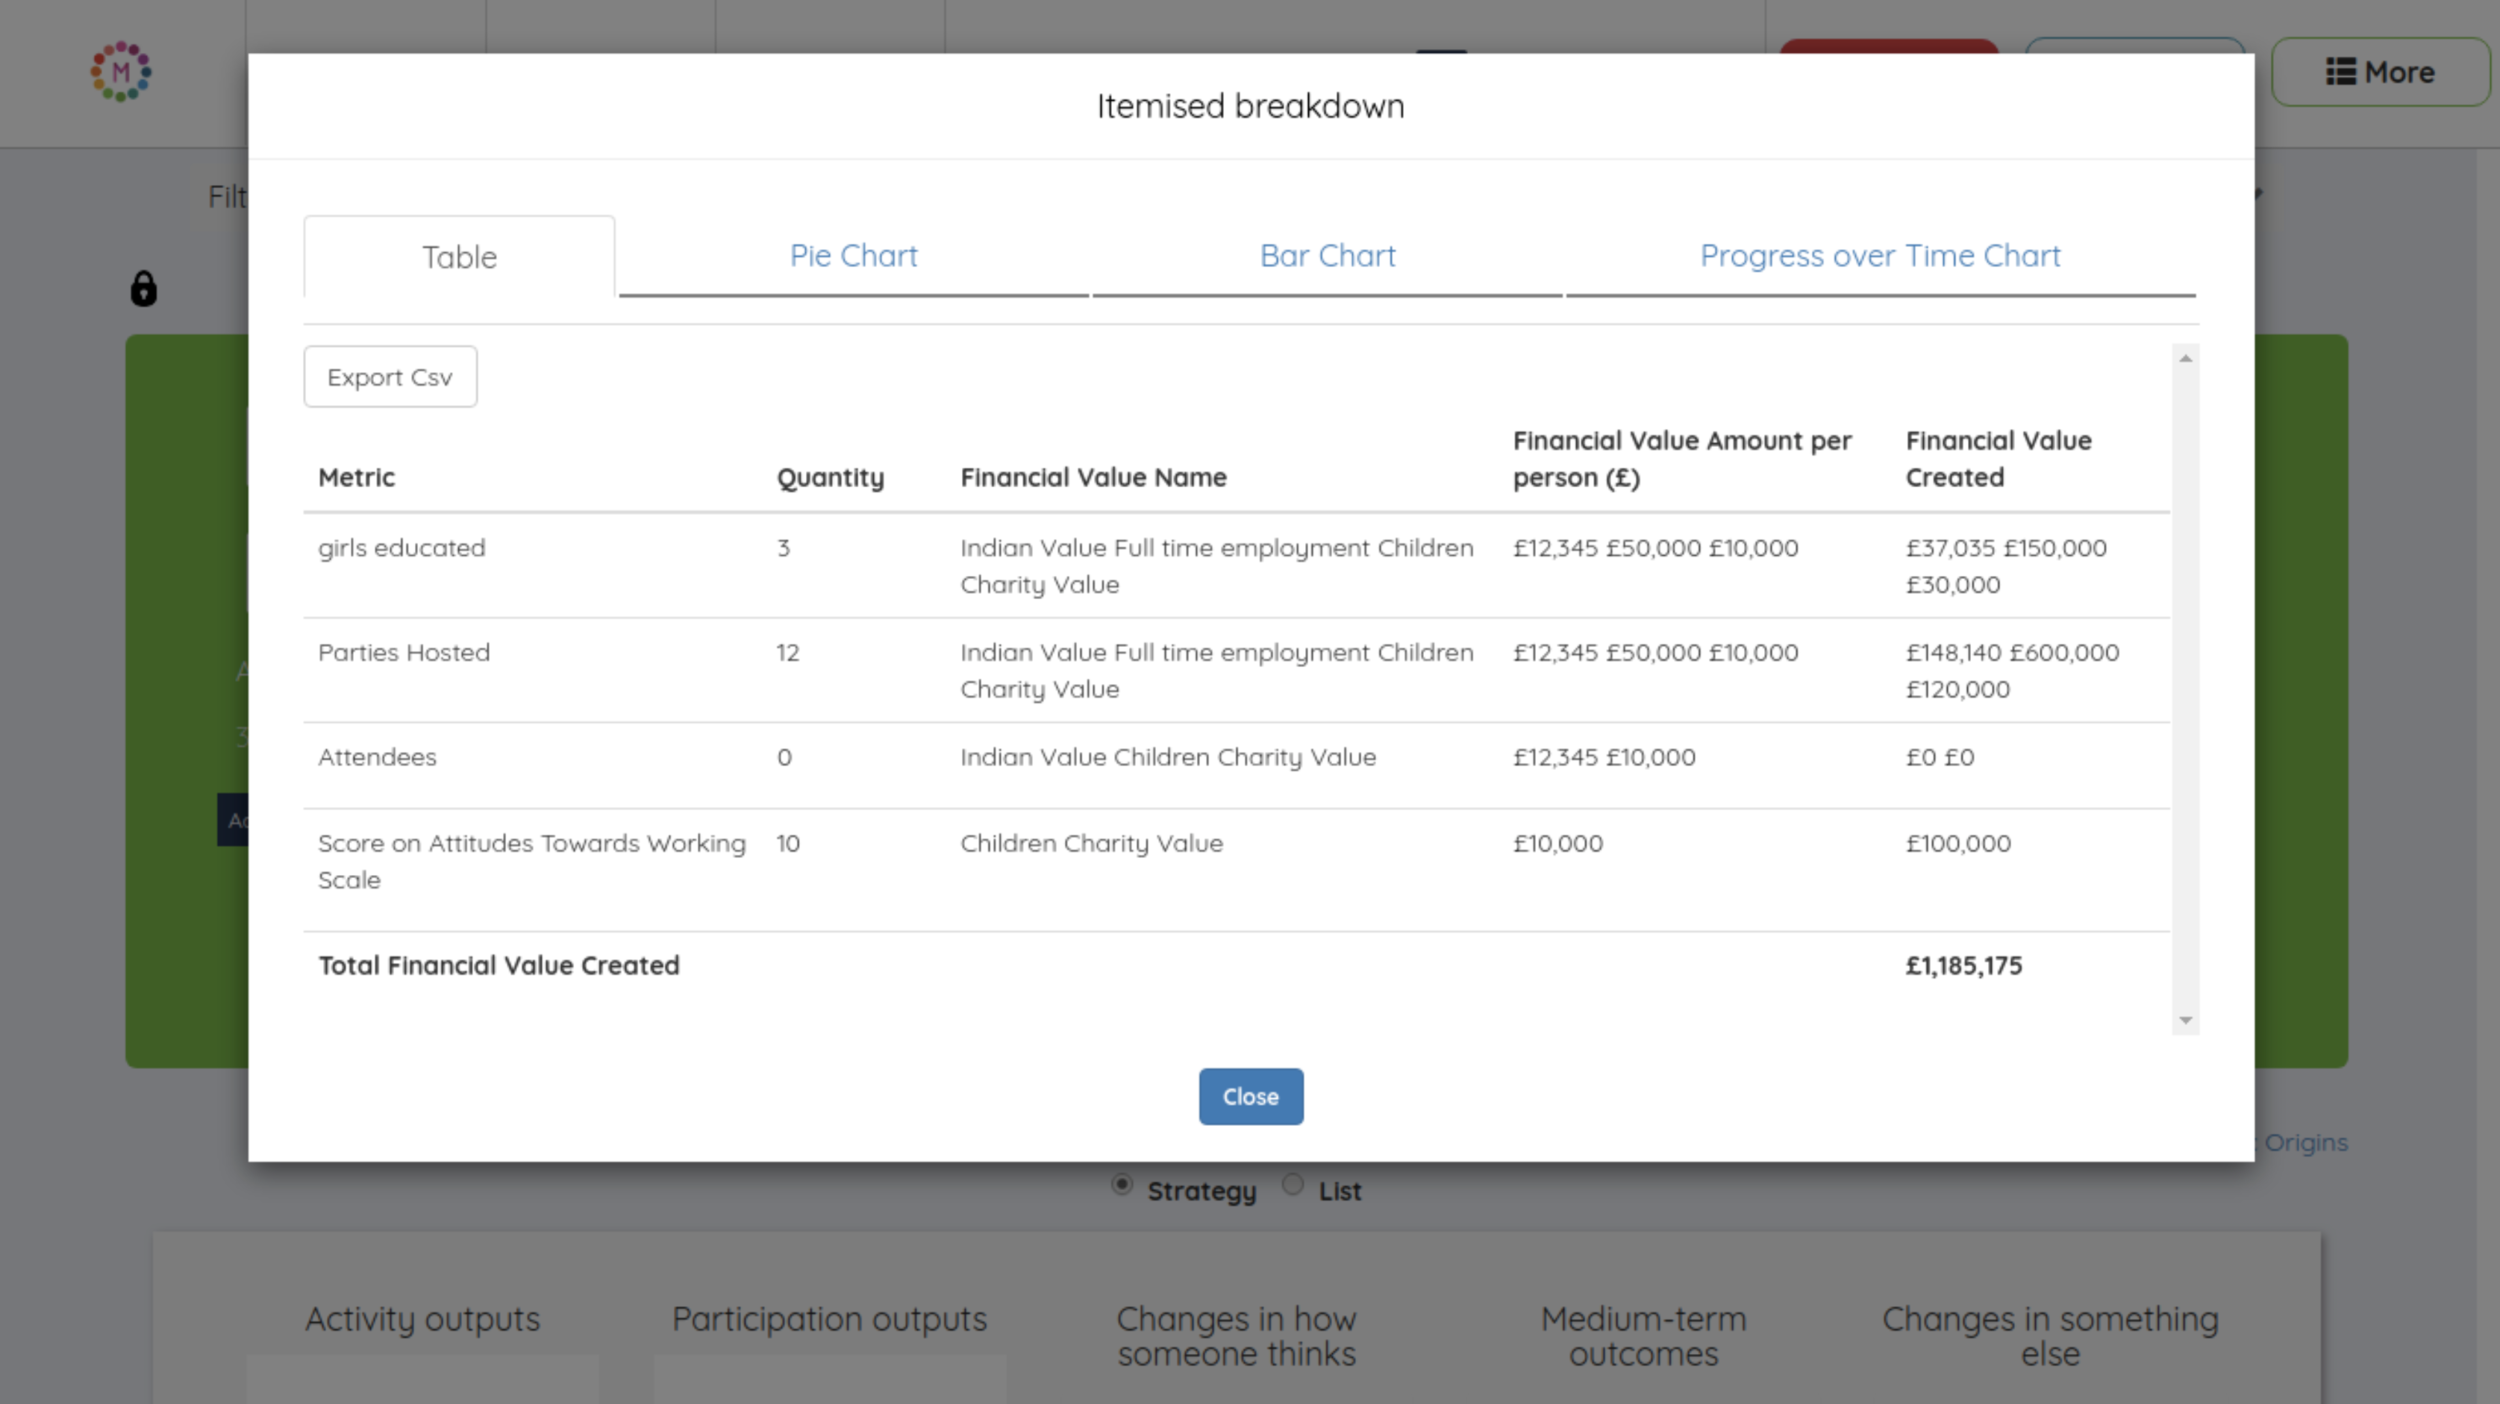
Social Value | SROI: Use our in-built calculator to show your Social Value in real-time
Calculate the Social Value of each programme you run
Forecast the Social Value of future projects and include within bids you tender for
Report the Social Value of your entire portfolio in real-time

Workflows: Integrate with other software
Impact Analytics is a cloud-based tool with a suite of APIs which can connect to a range of:
Data collection software and apps
Databases & CRMs
Reporting software
Operational and Accounting software

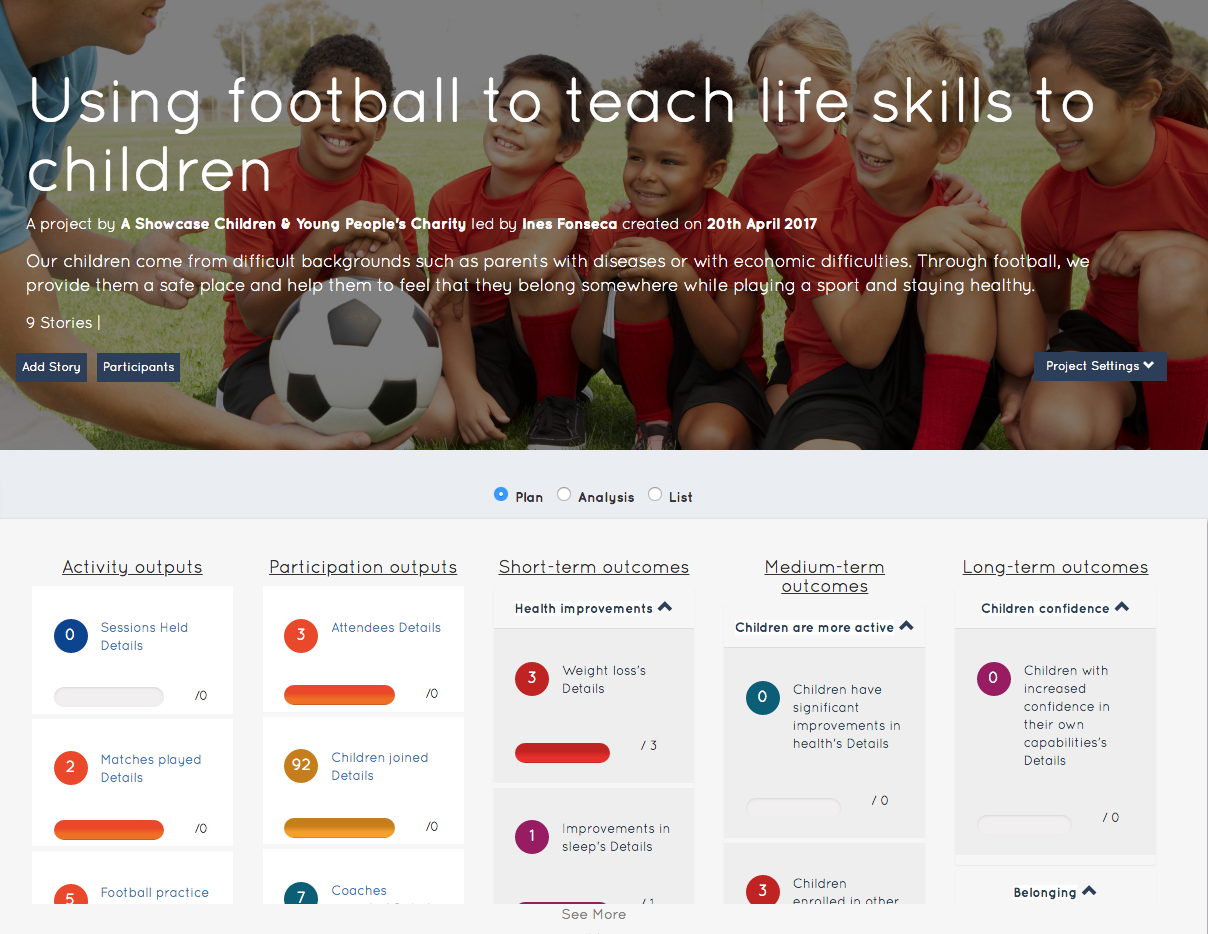
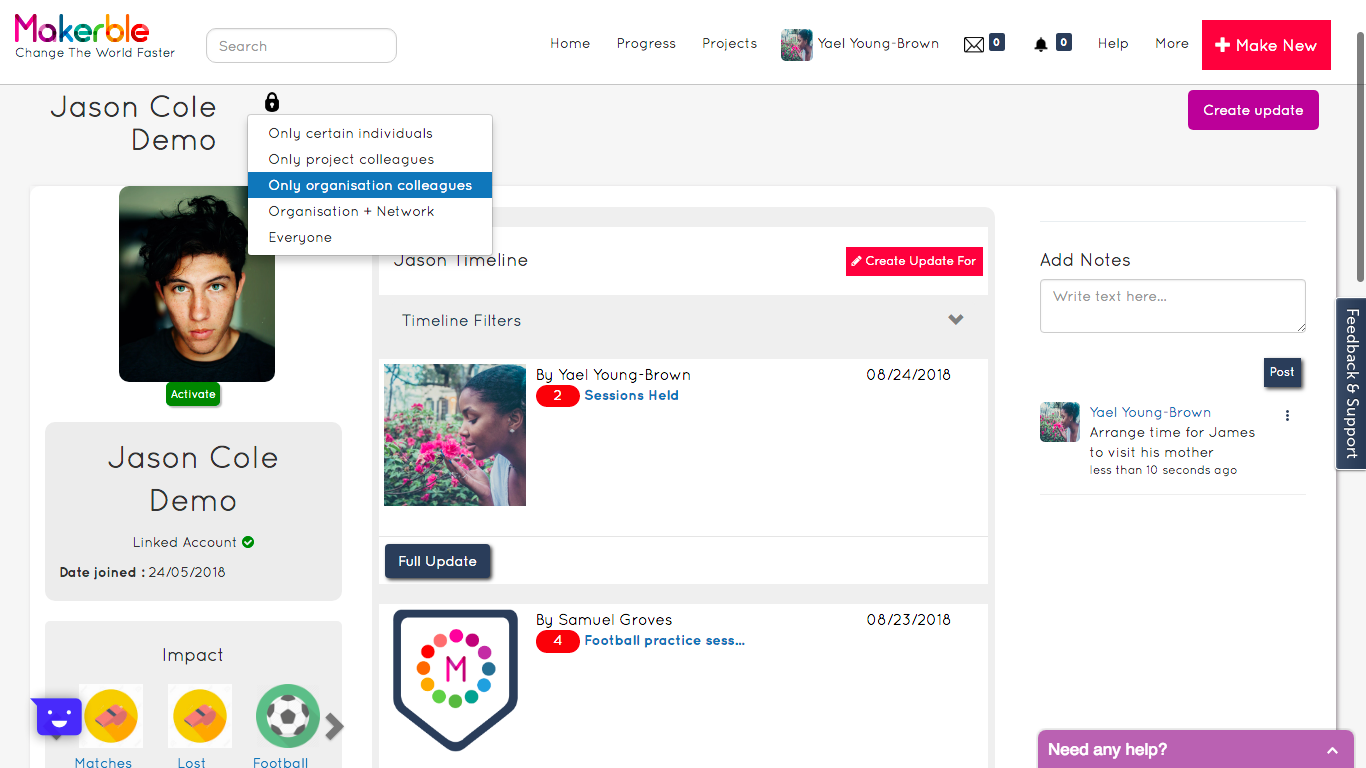
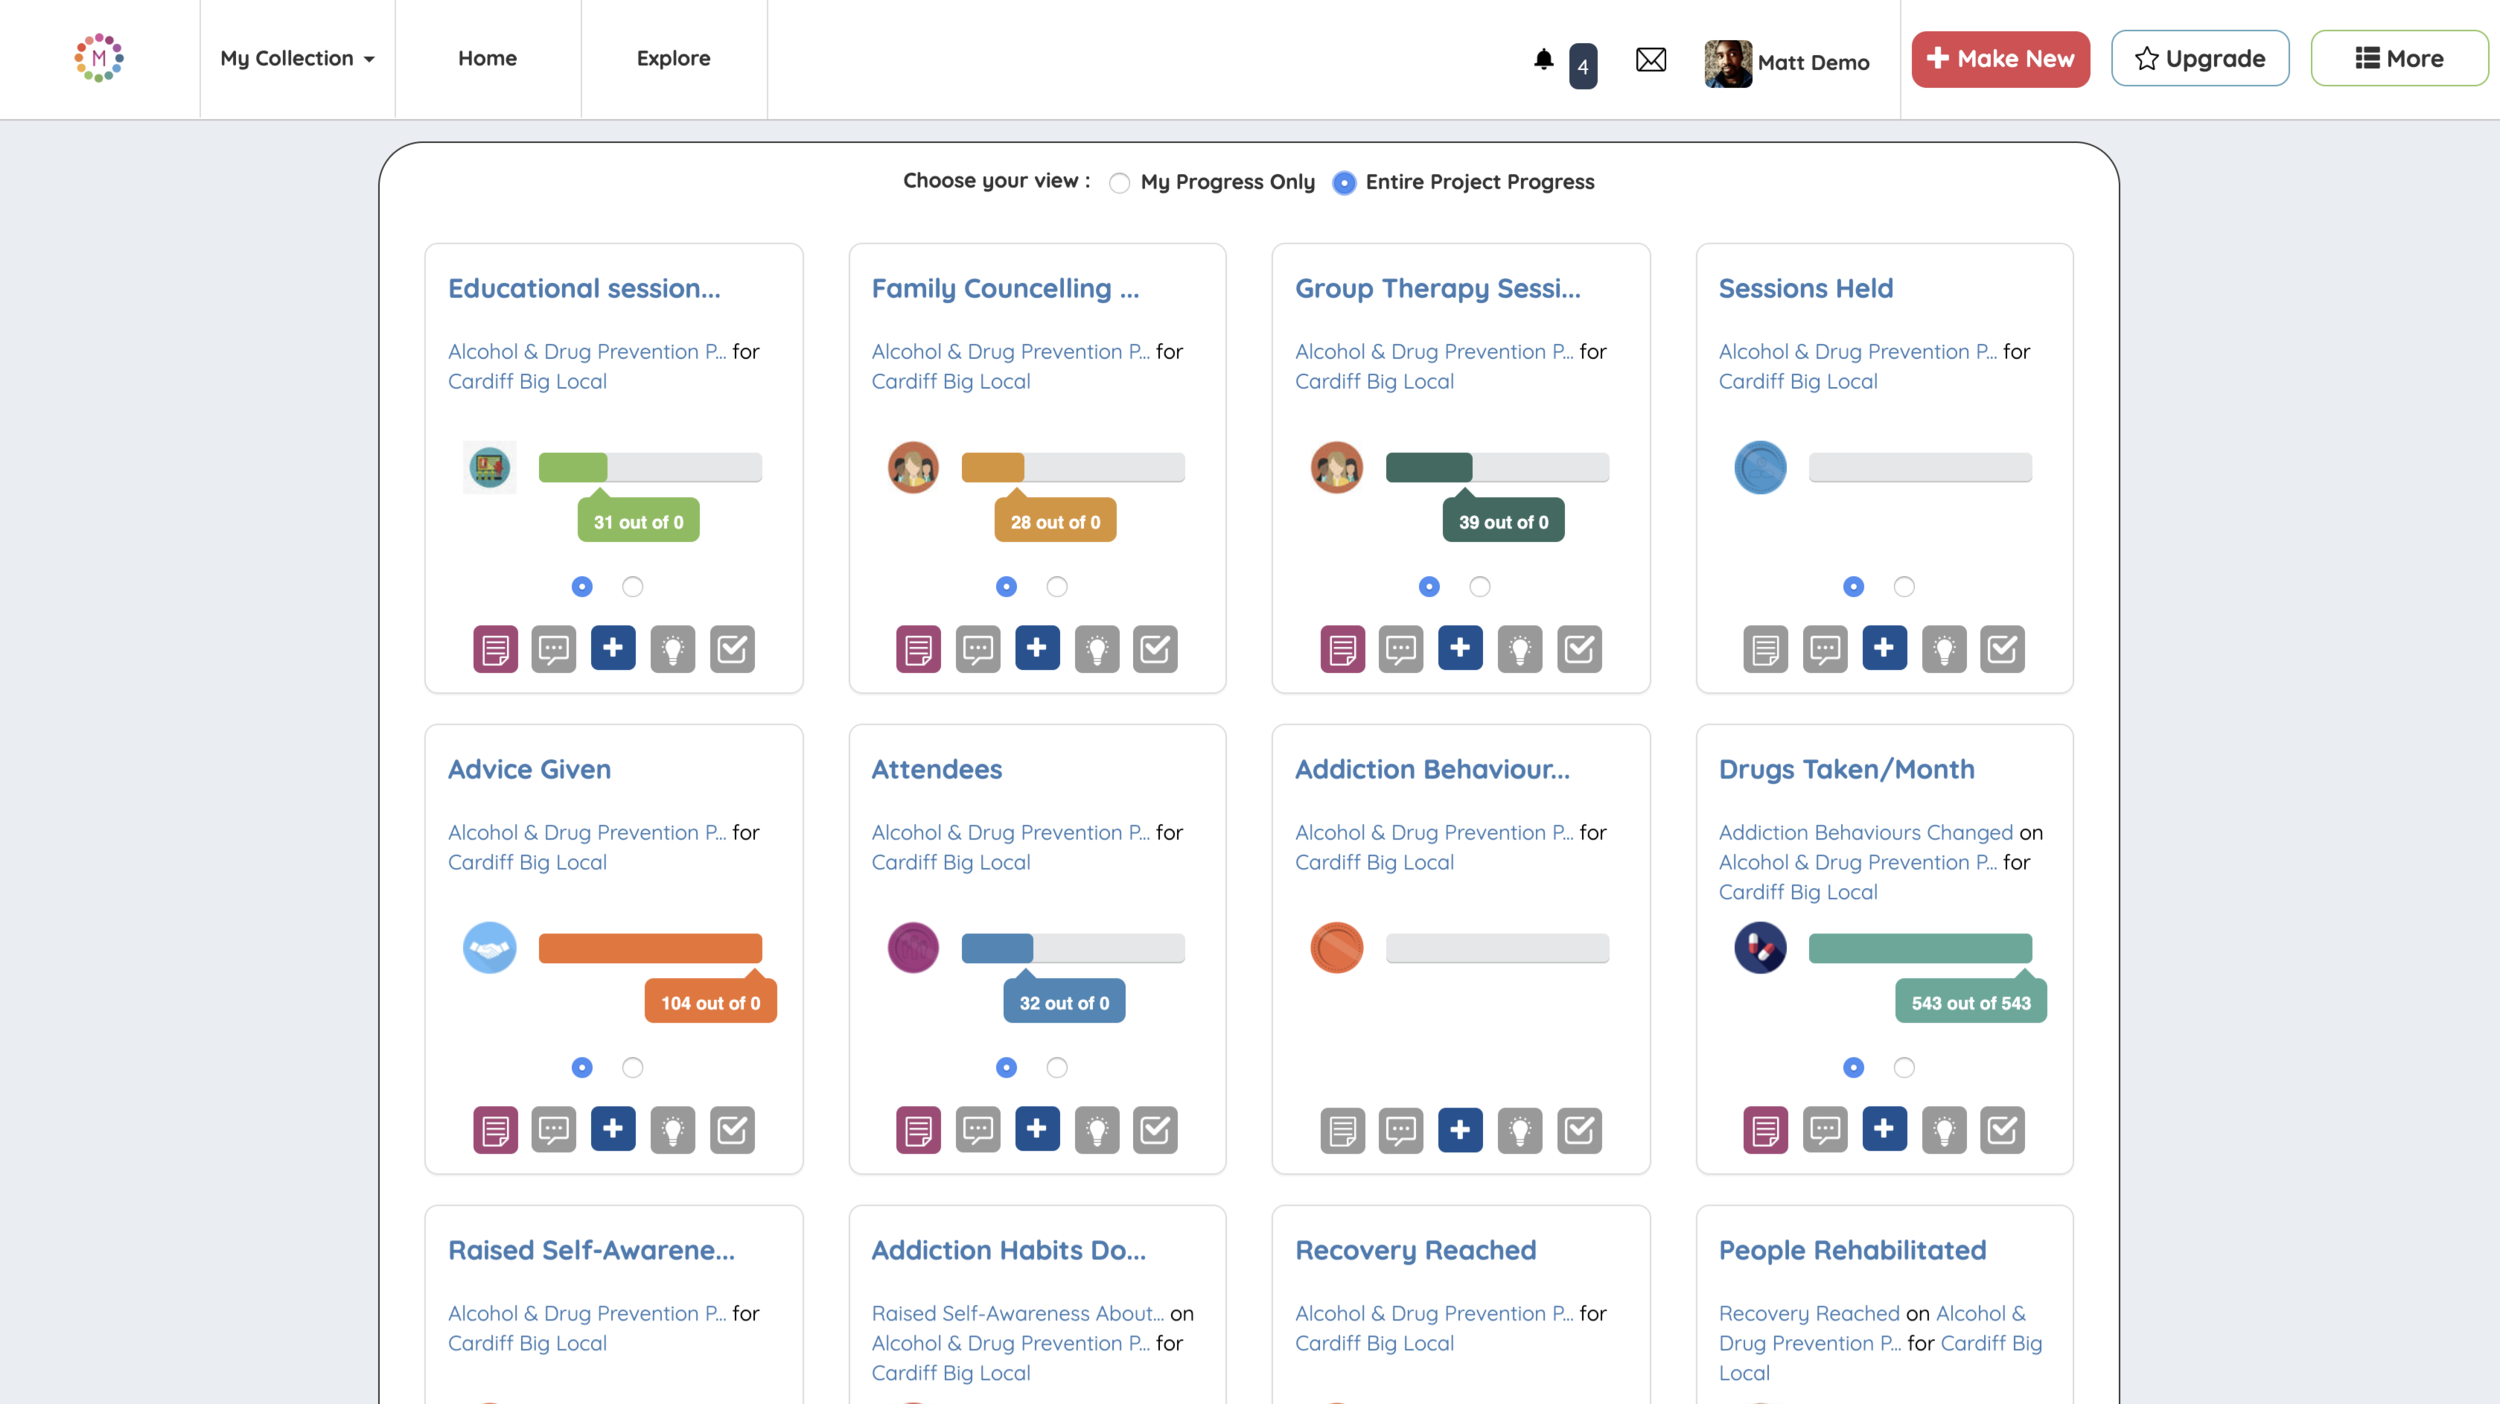
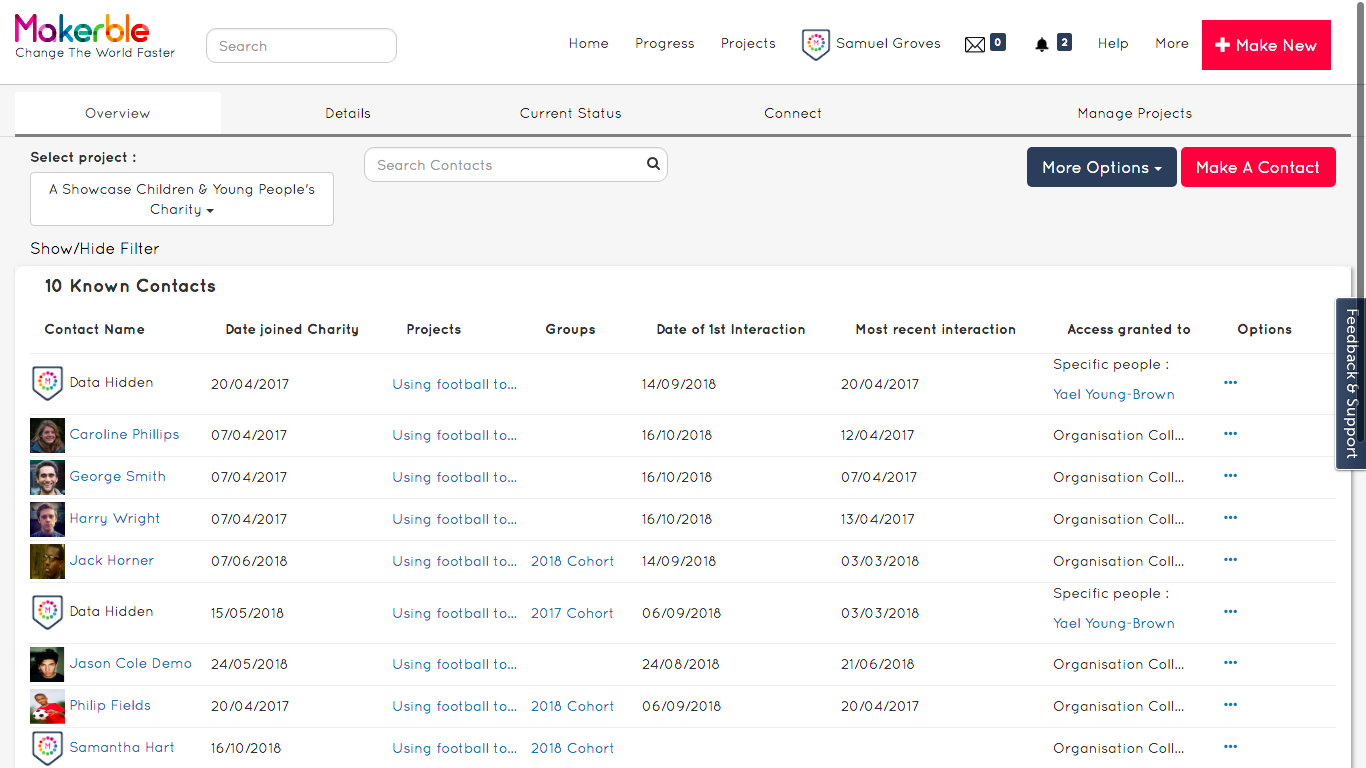
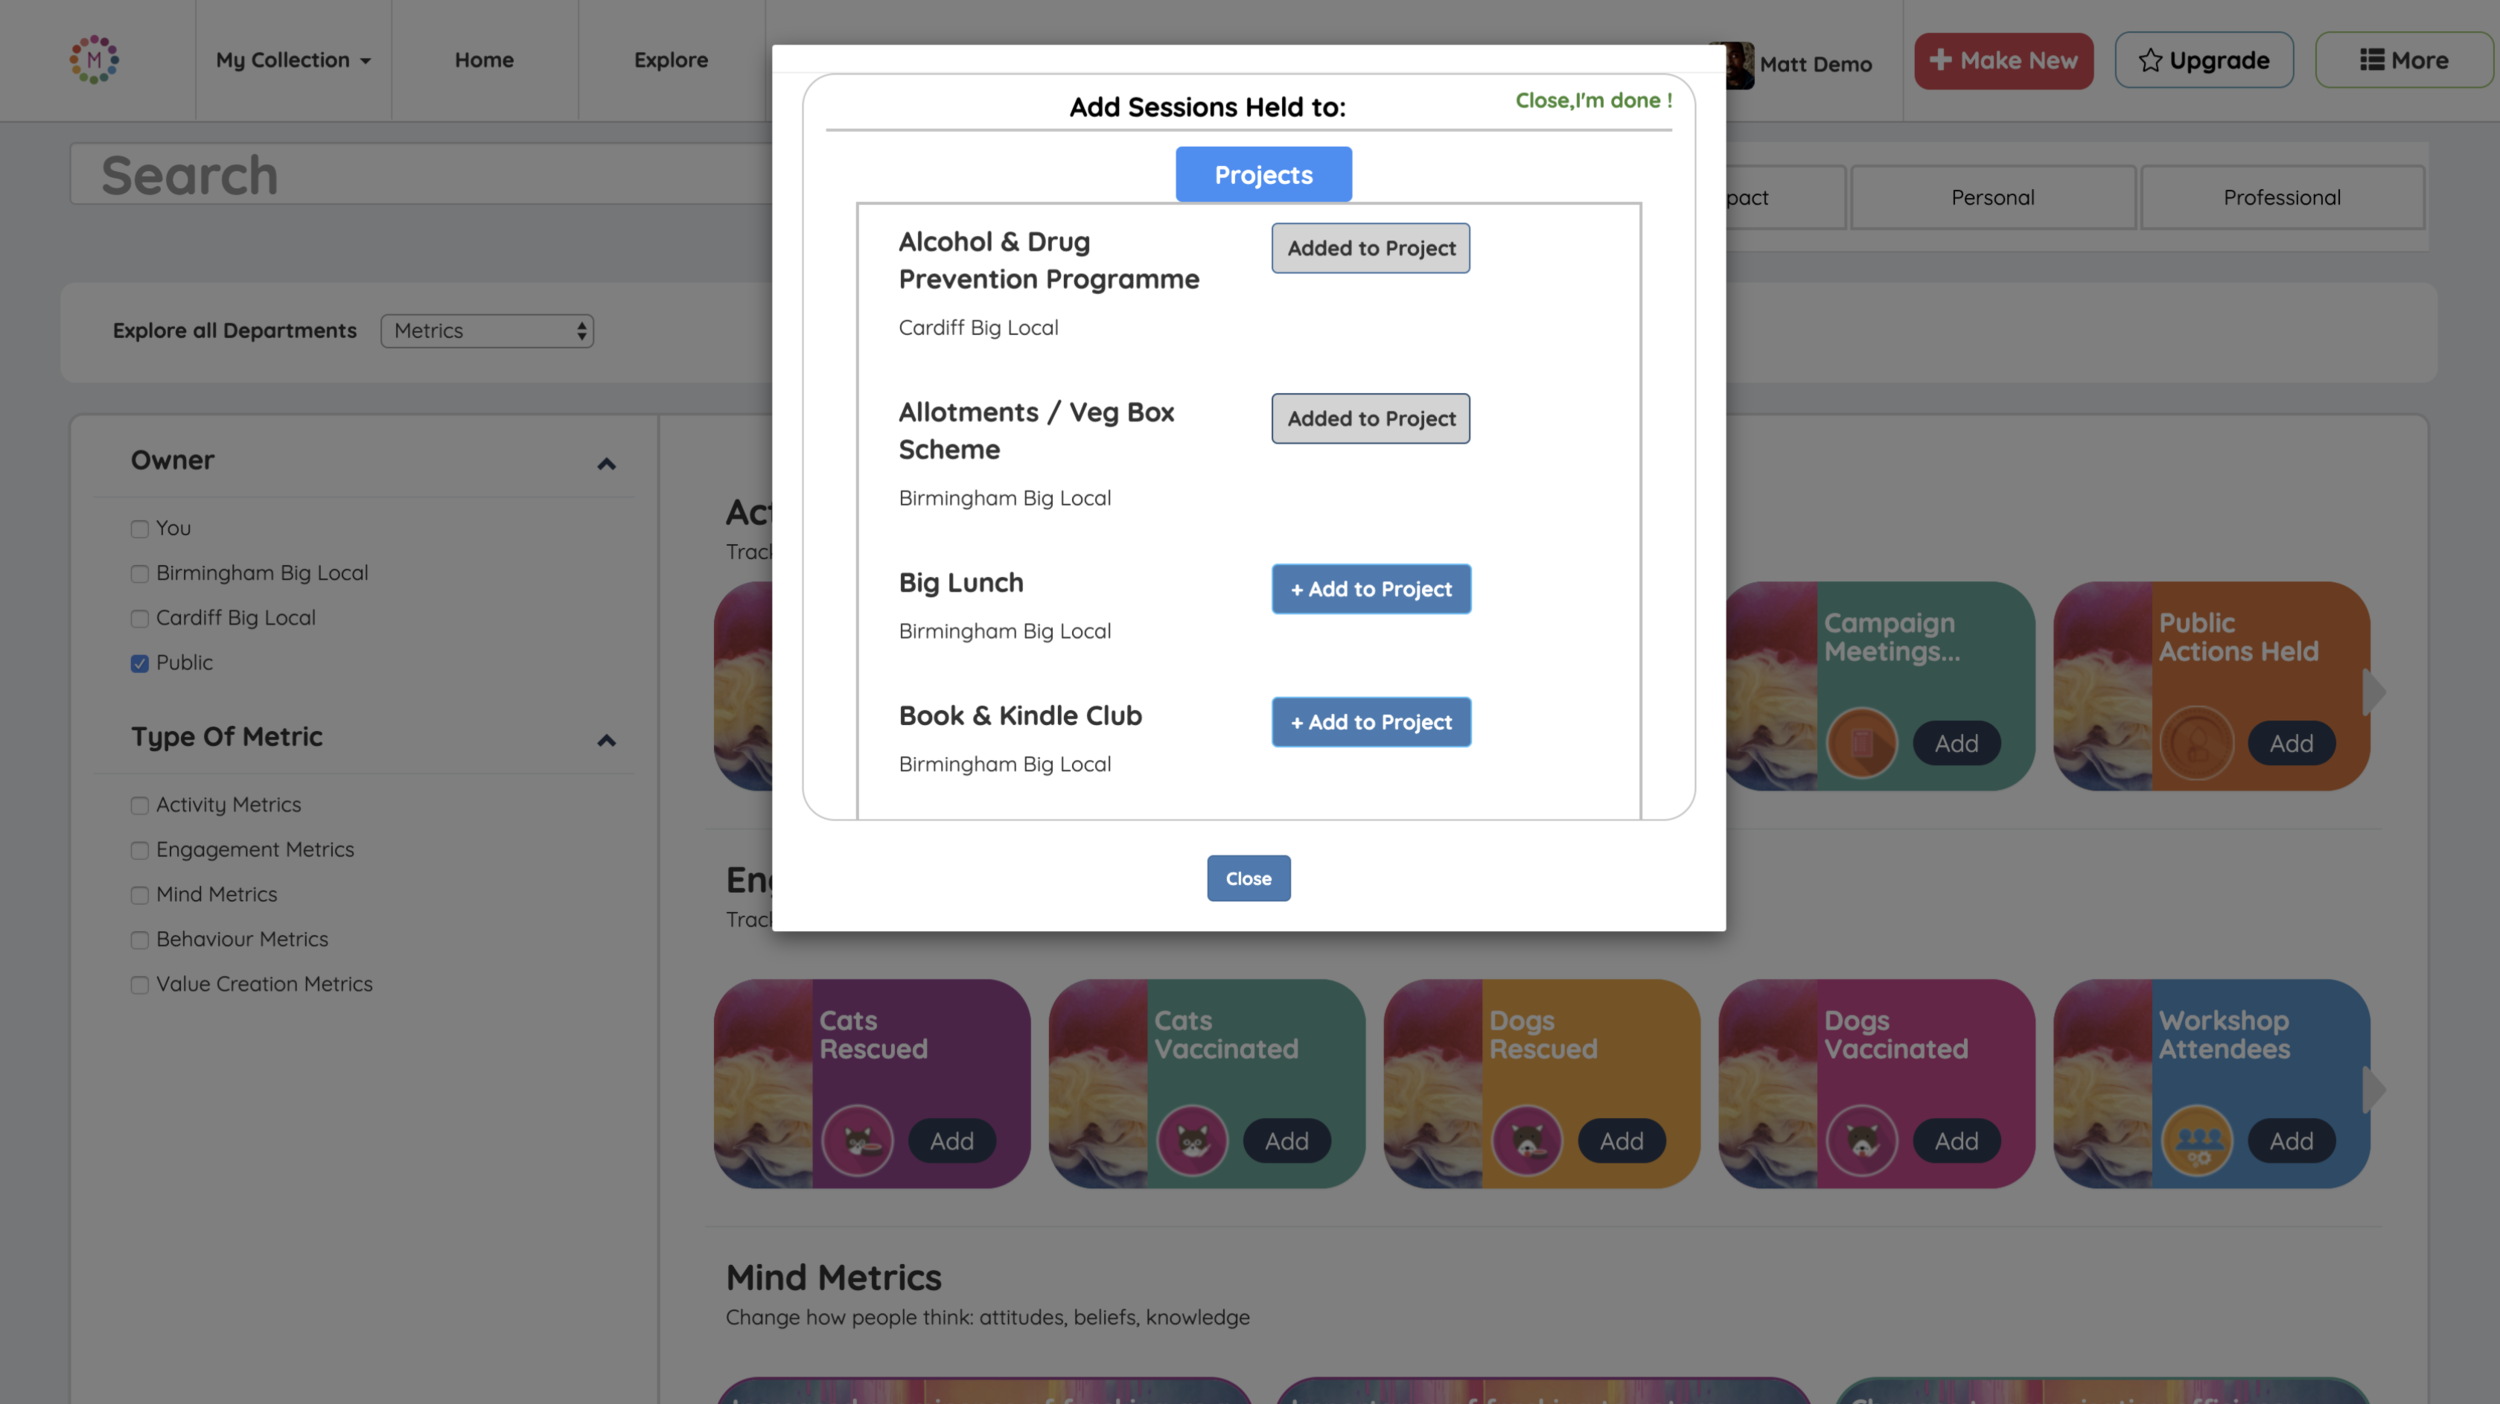
Programme Management: Monitor beneficiaries, outcomes and targets
Group projects into “bundles”. Projects exist within multiple bundles so you can easily create bundles for each
Register new beneficiaries
Report on indicators and activities at a group level, e.g. 30 people vaccinated
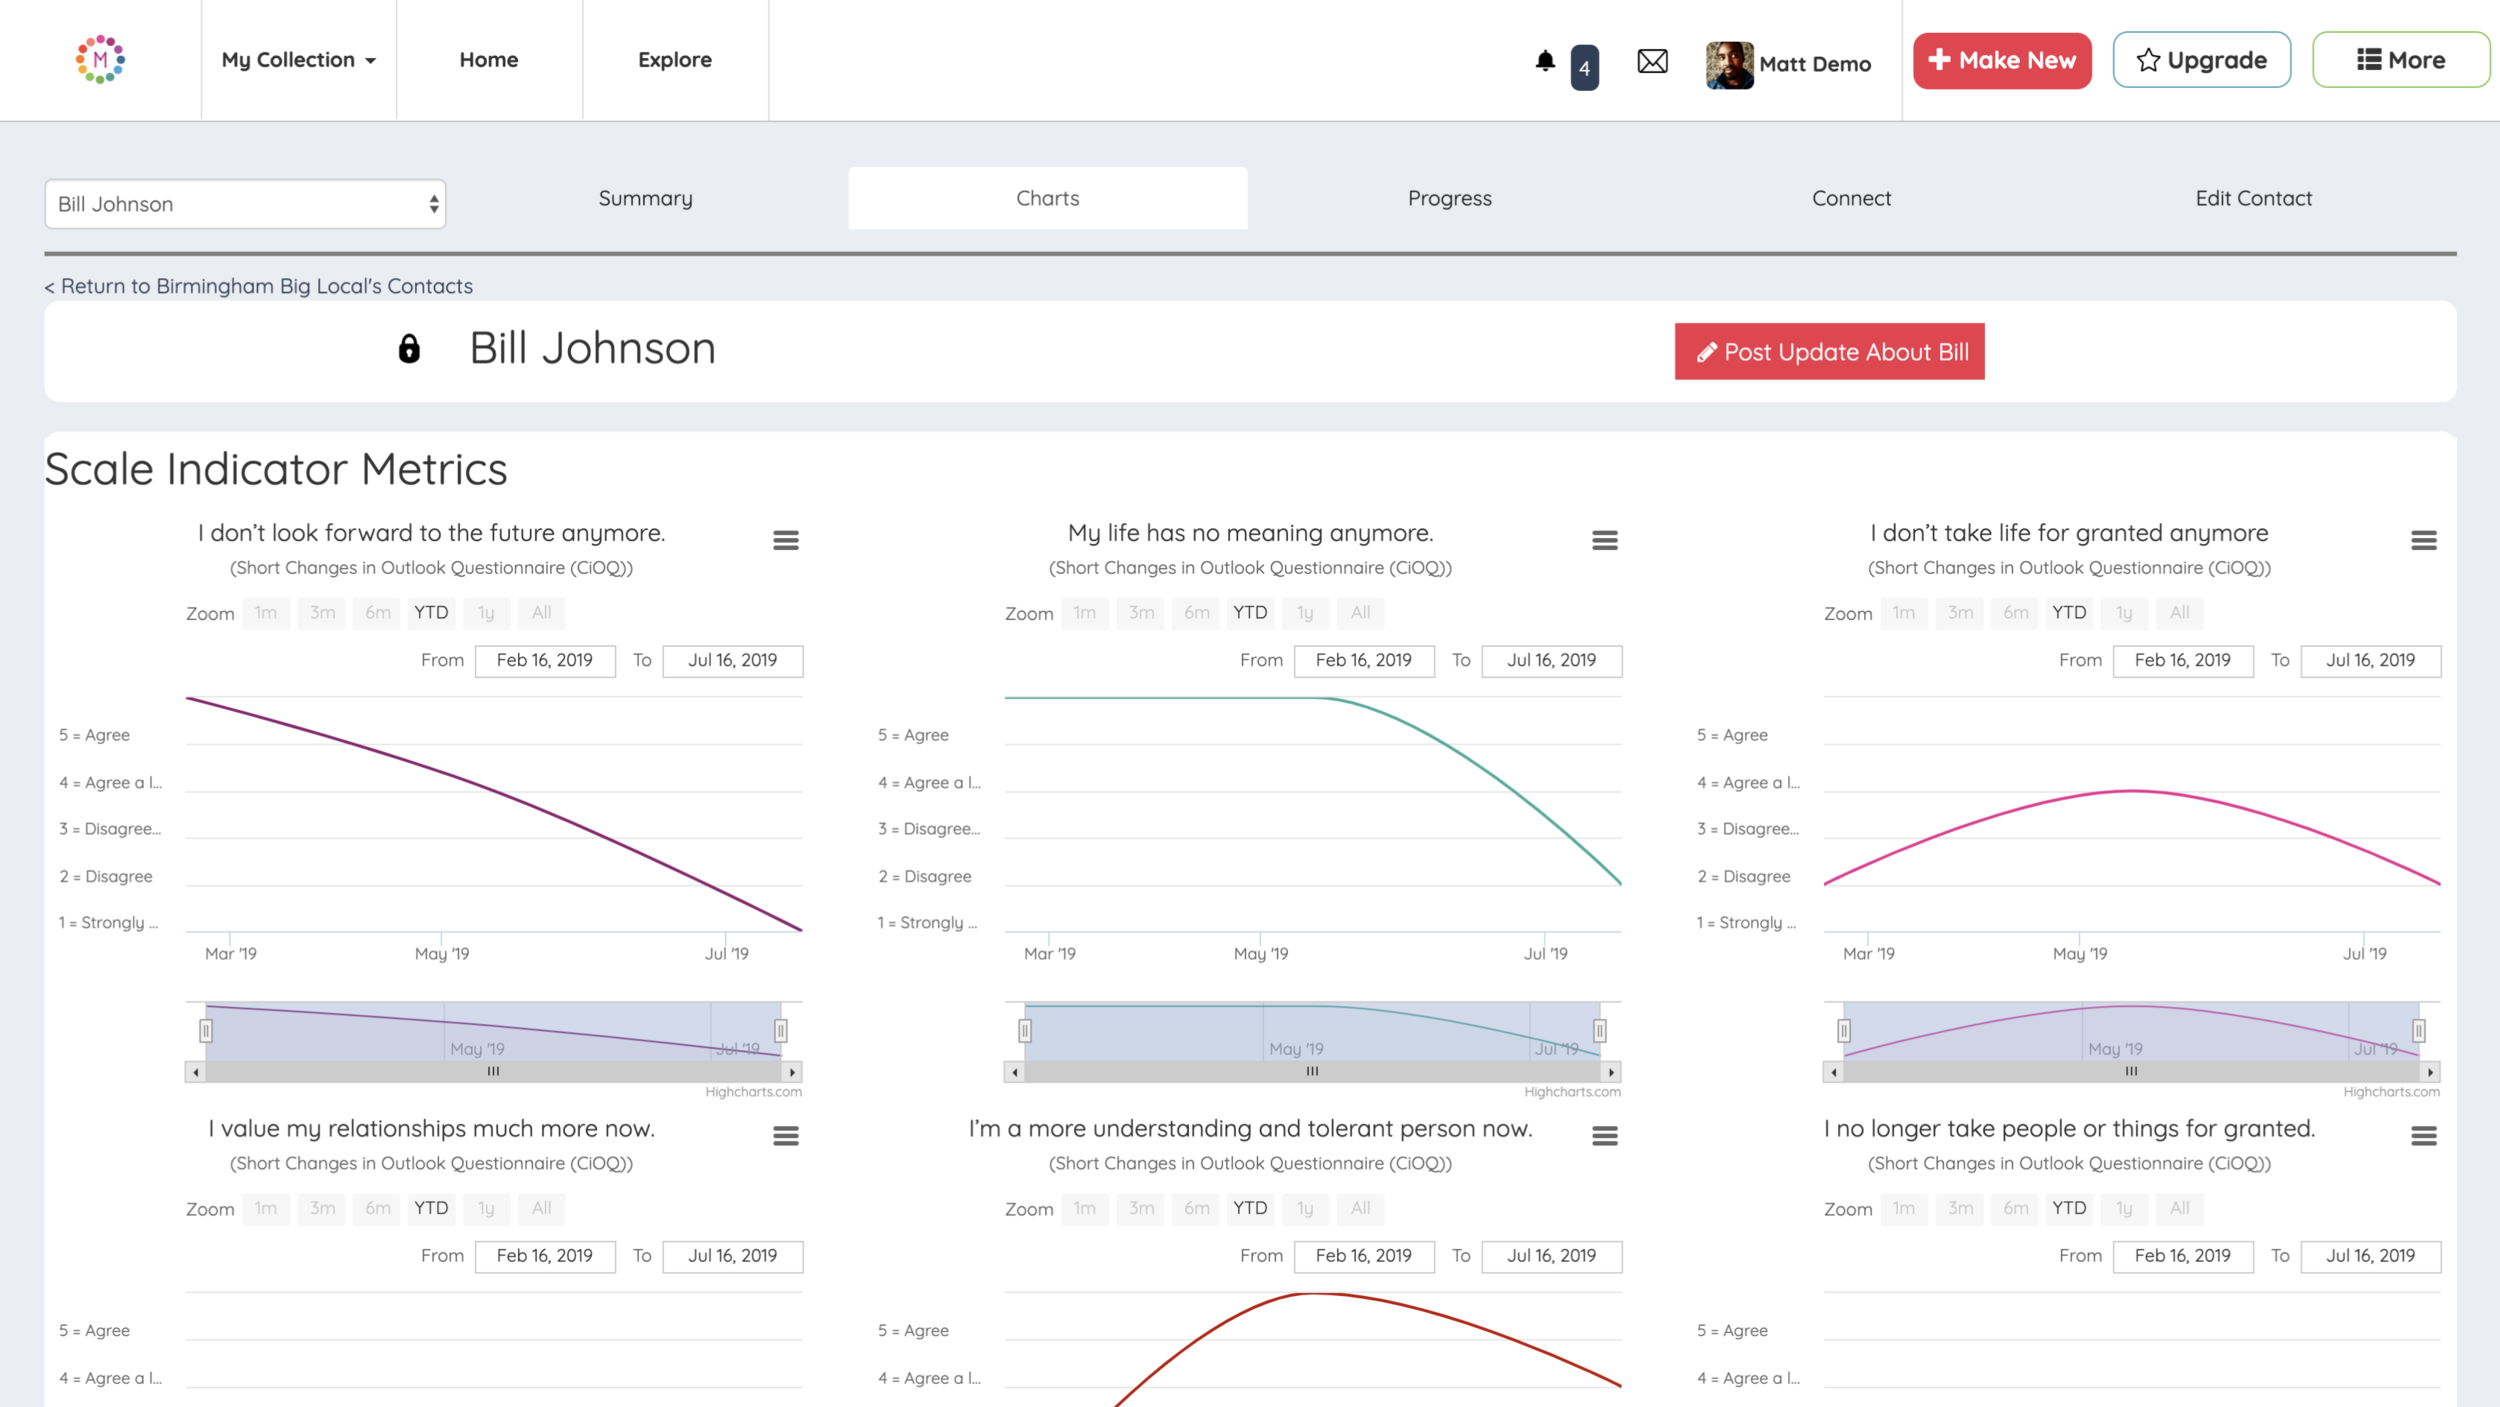
Report on indicators at an individual level, e.g. Joseph was vaccinated
Conduct surveys and scored assessments - both anonymous and assessments that are linked to individuals. Collect multiple choice responses, soundbites, videos, pictures, free text and files attachments.
Create alerts for when progress slips behind schedule.
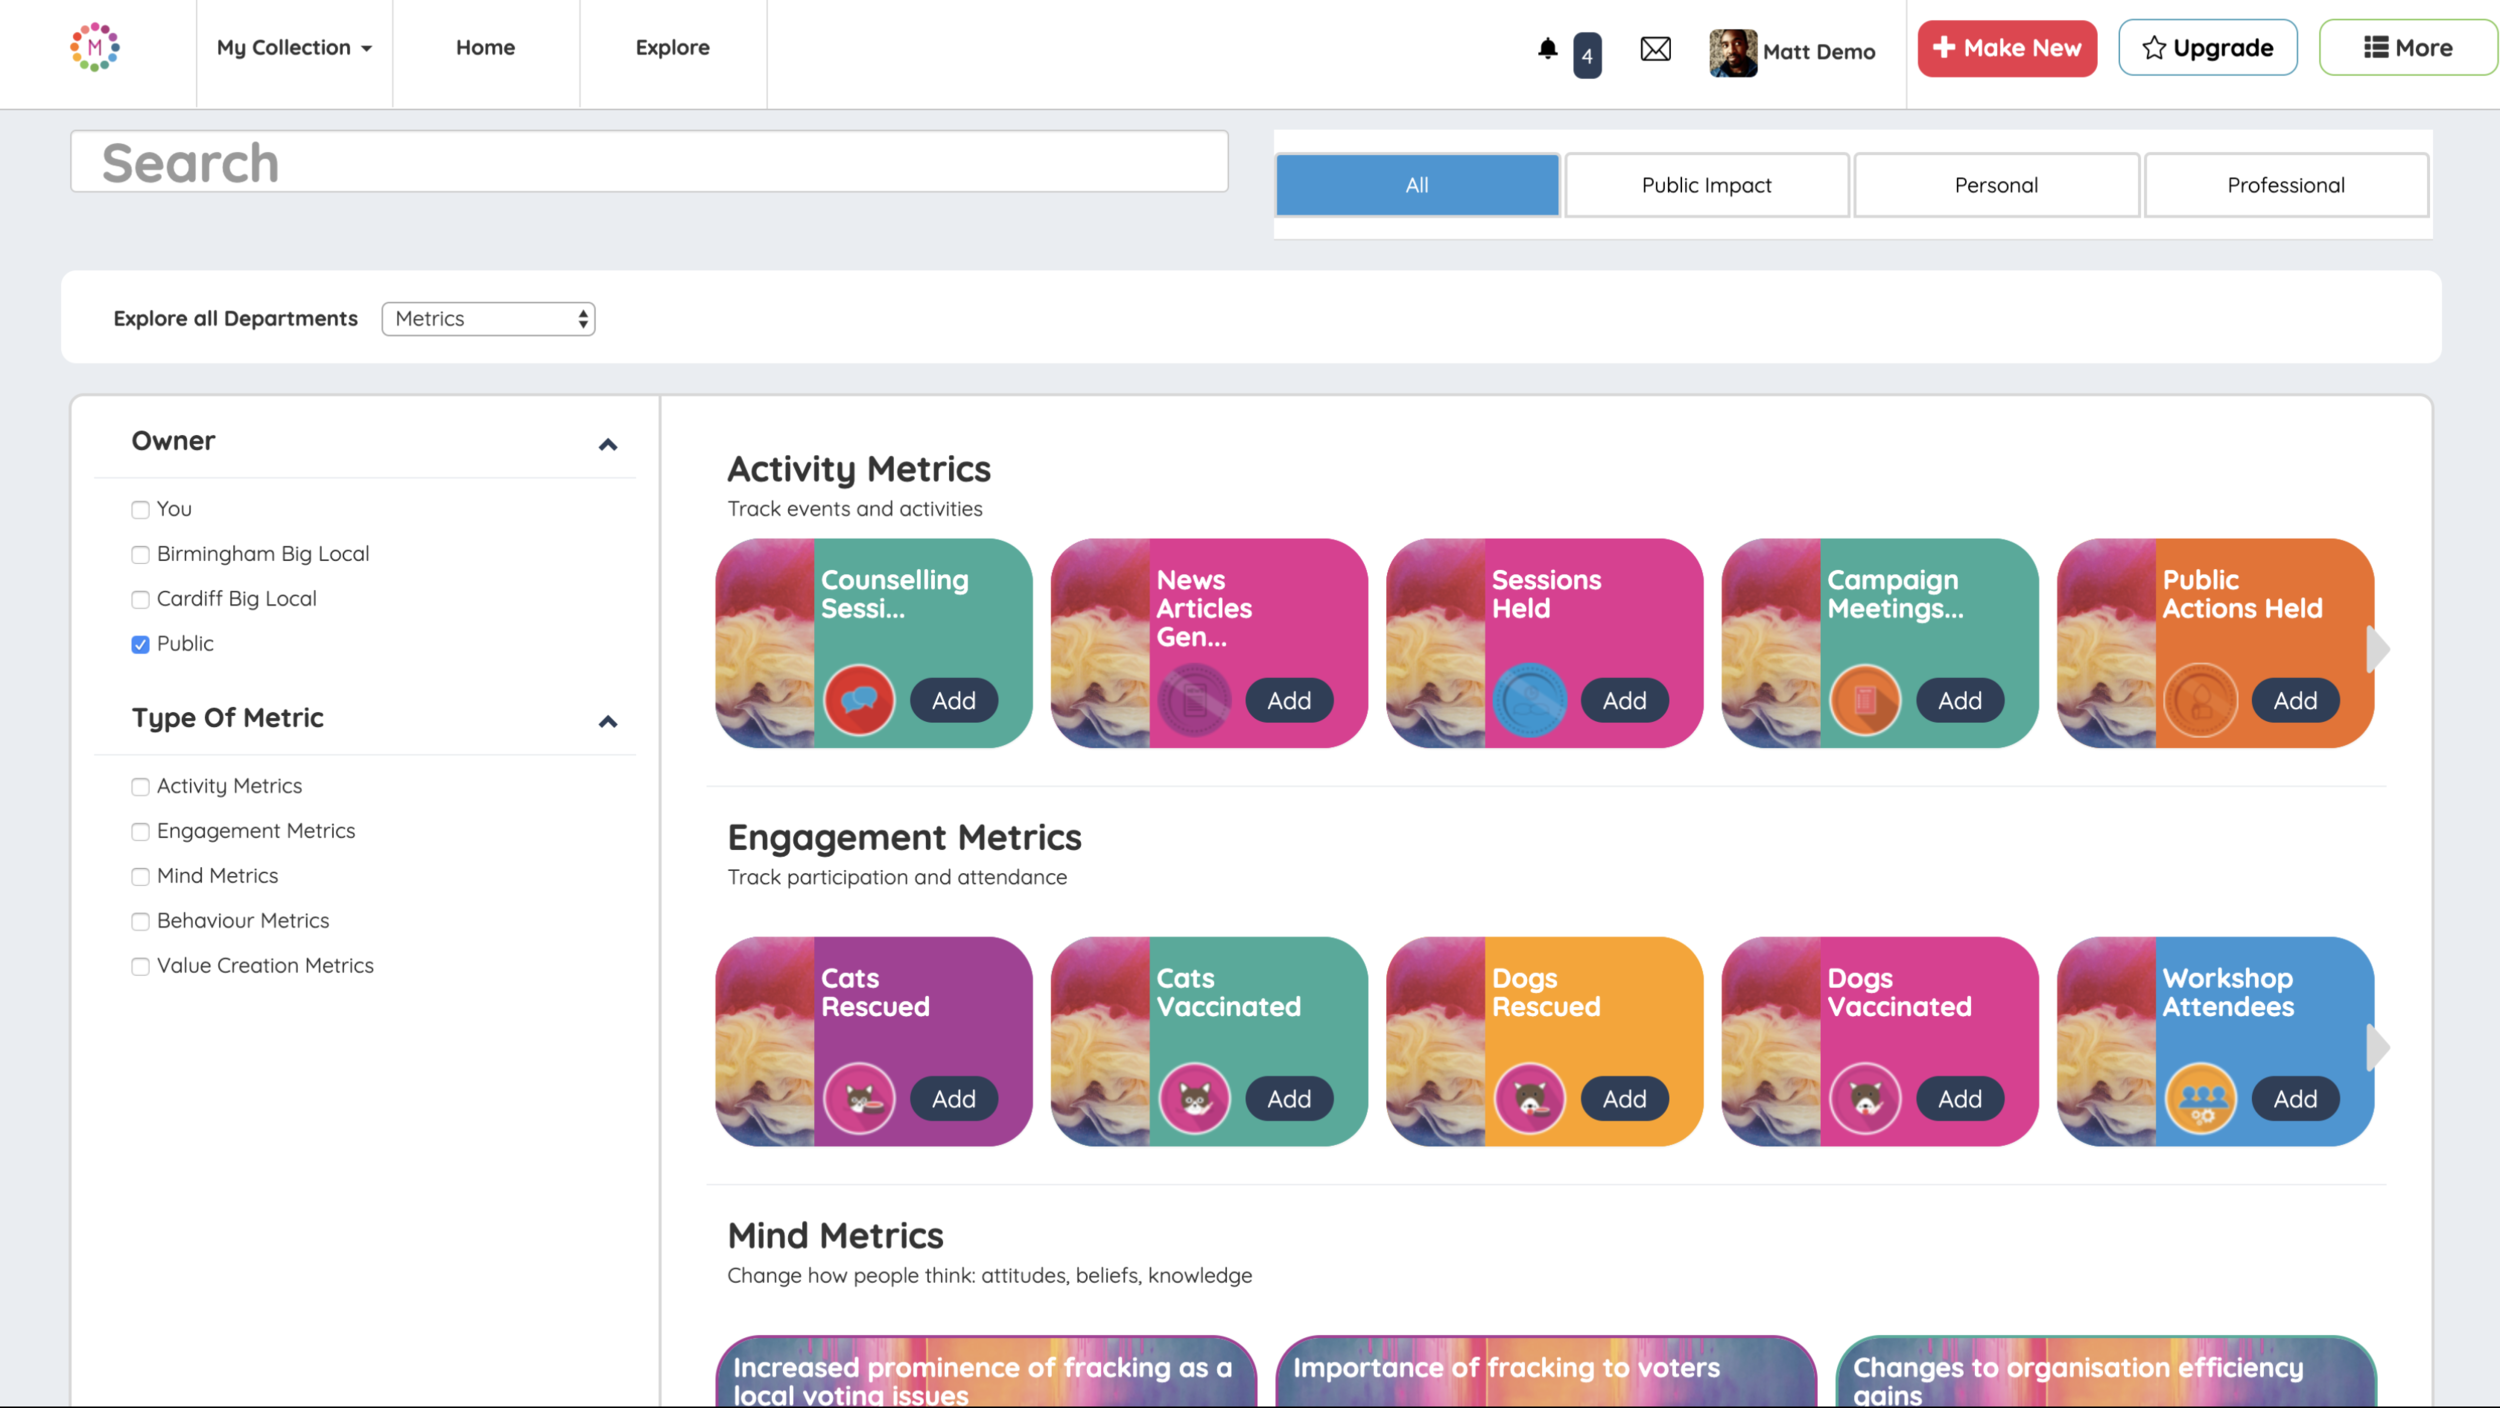
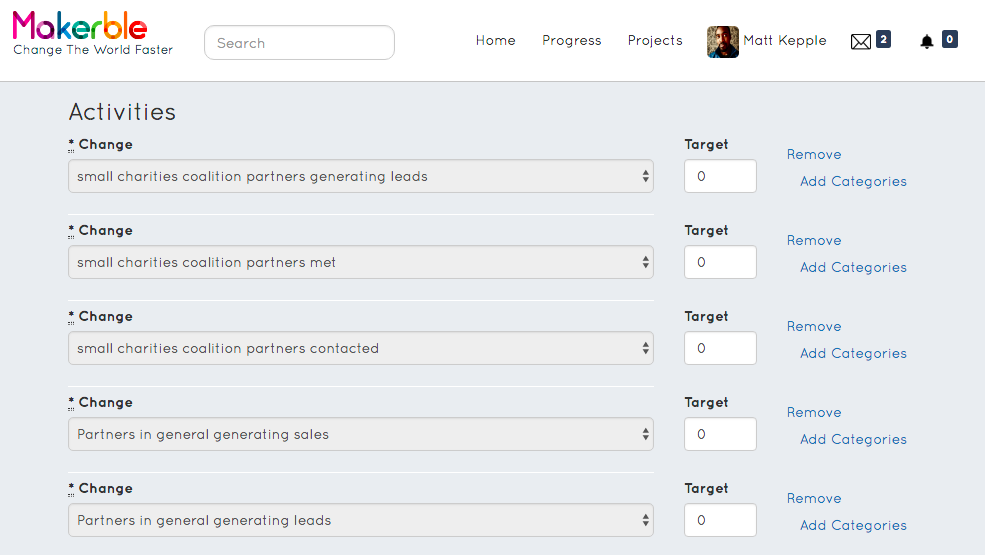
Self-Service Setup: Build your own forms. Choose your own indicators.
Browse our library of Surveys & Assessments or create your own
Choose from existing Outcomes & Indicators or create your own
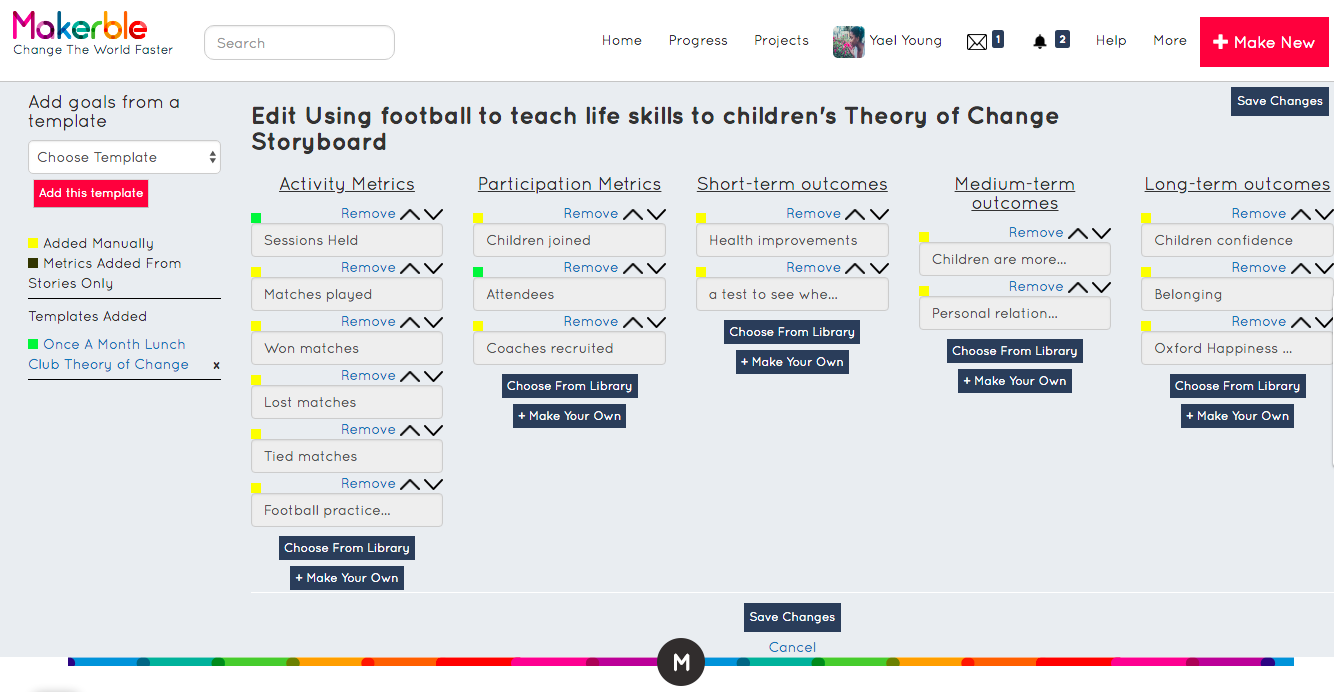
Create templates of Theories of Change which you can apply to multiple projects at once
Reporting: Use your data to show Distance Travelled and more
Segment your results by Age, Gender, Ethnicity or any segmentation of your choosing. Impact Analytics has an inbuilt audit trail which enables you to see the original data that your results are calculated from at any time.

Qualitative Coding: Add labels to case studies
Create your own labels
Share labels across colleagues or use them privately
Use labels to code your qualitative data, whether it’s case studies, case notes, updates or other files

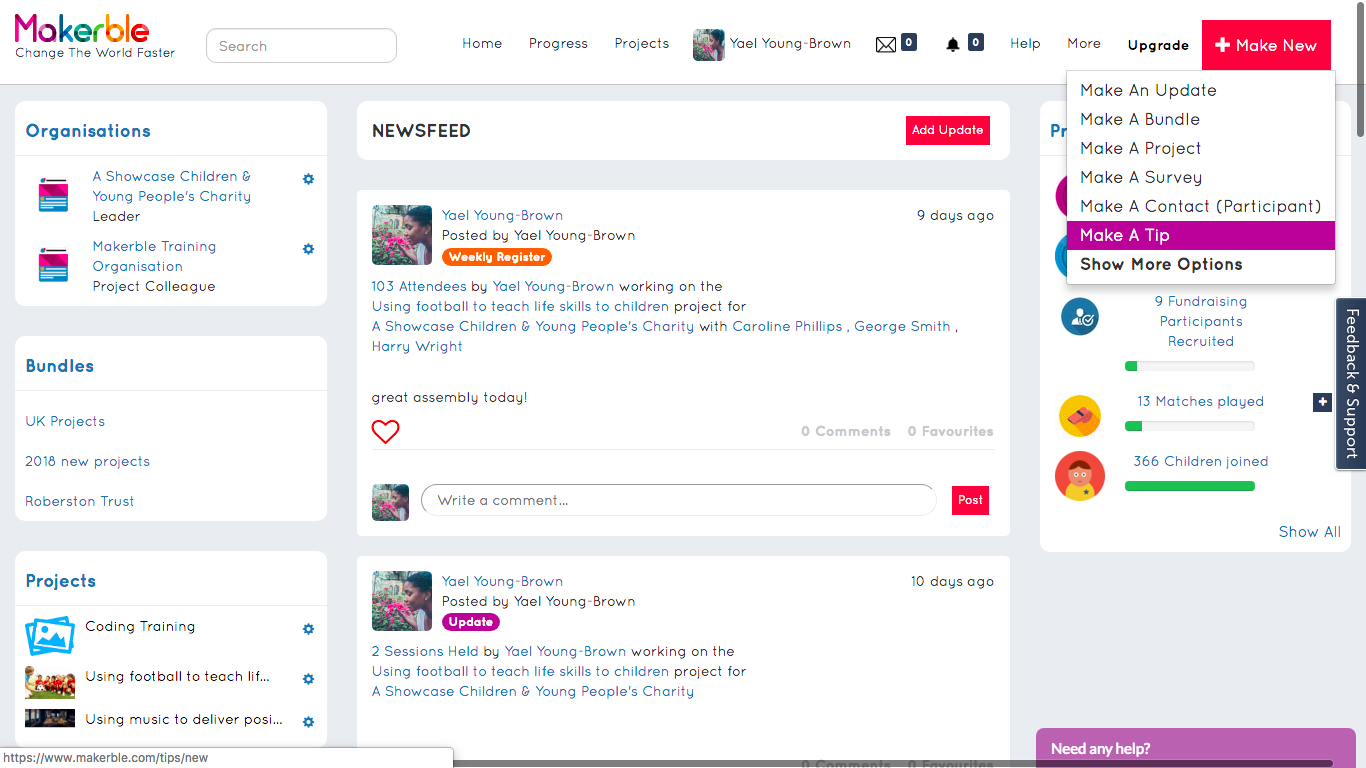
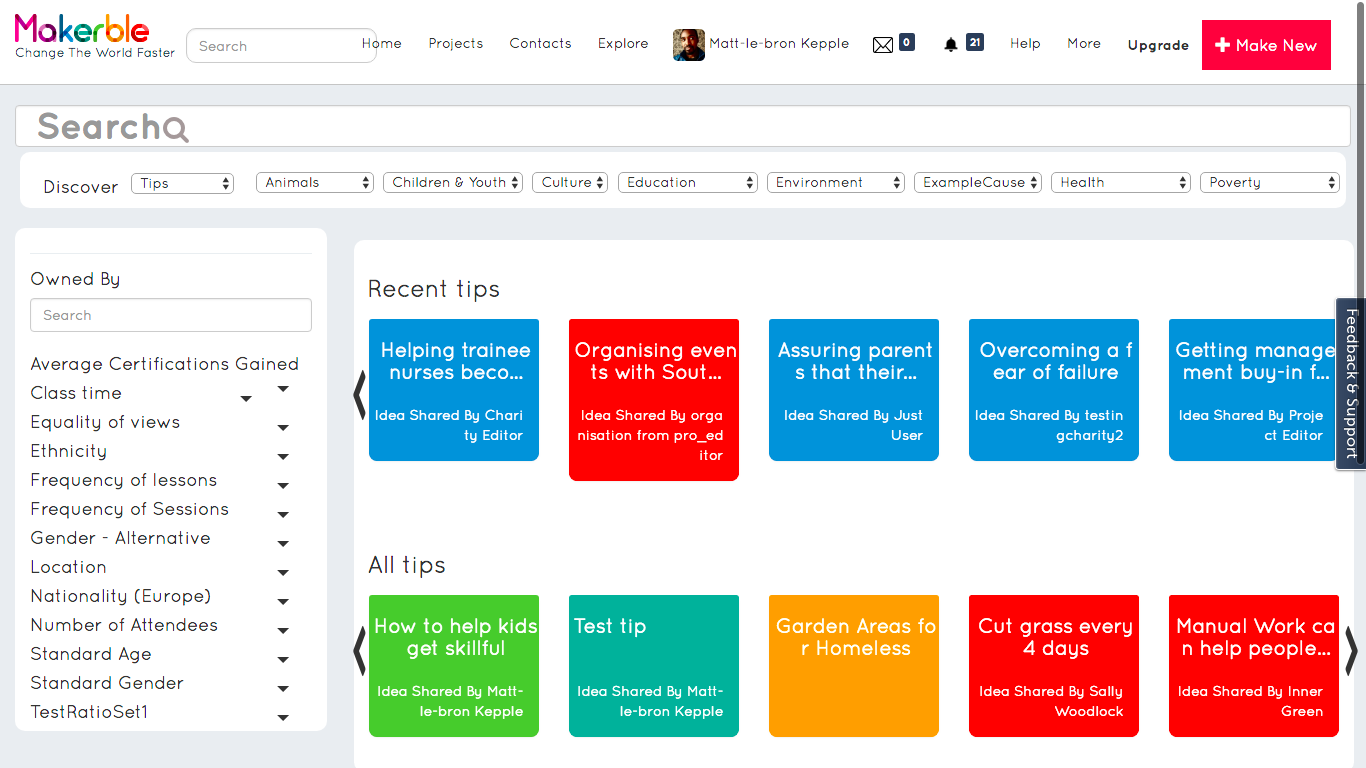
Learning: Make best practice easily discoverable and directly applicable
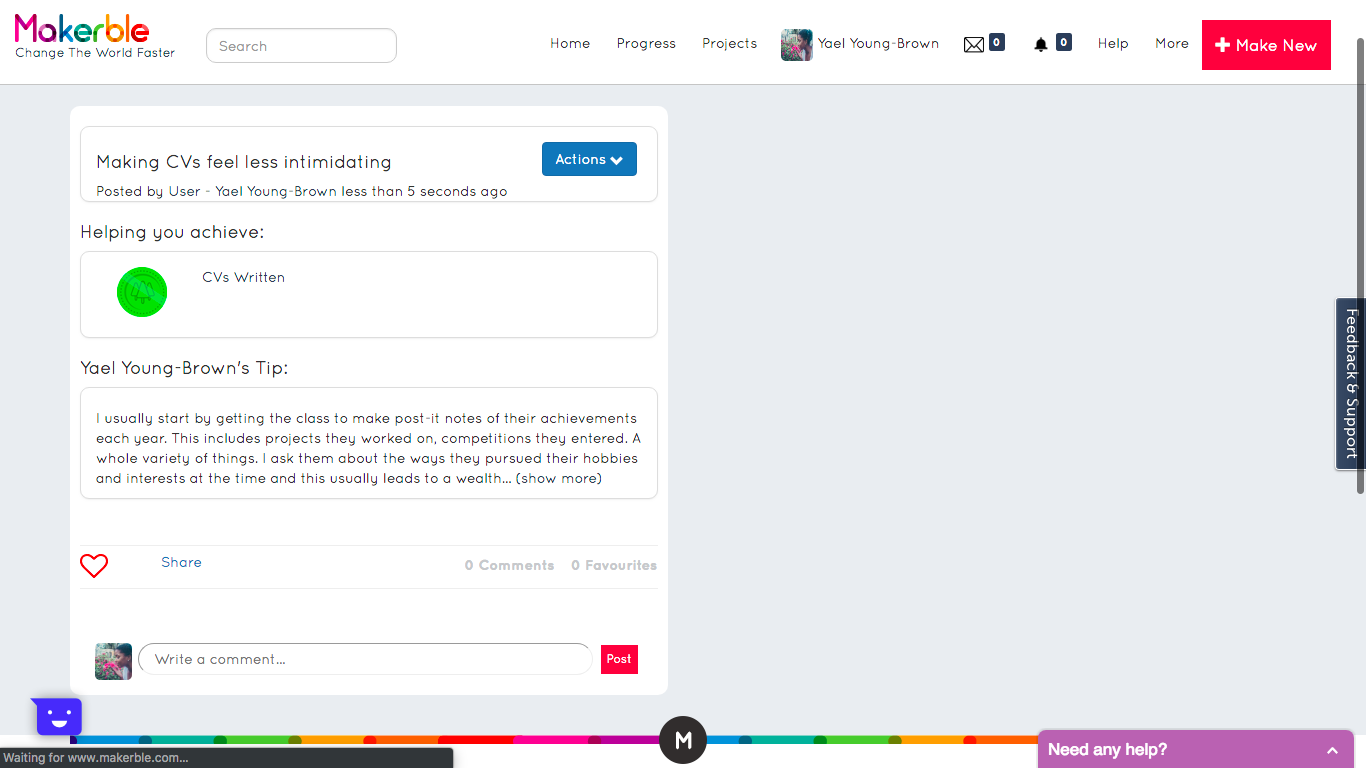
Create a constantly updated repository of best practice which everyone on your team can contribute to, comment on and access directly within Impact Analytics.
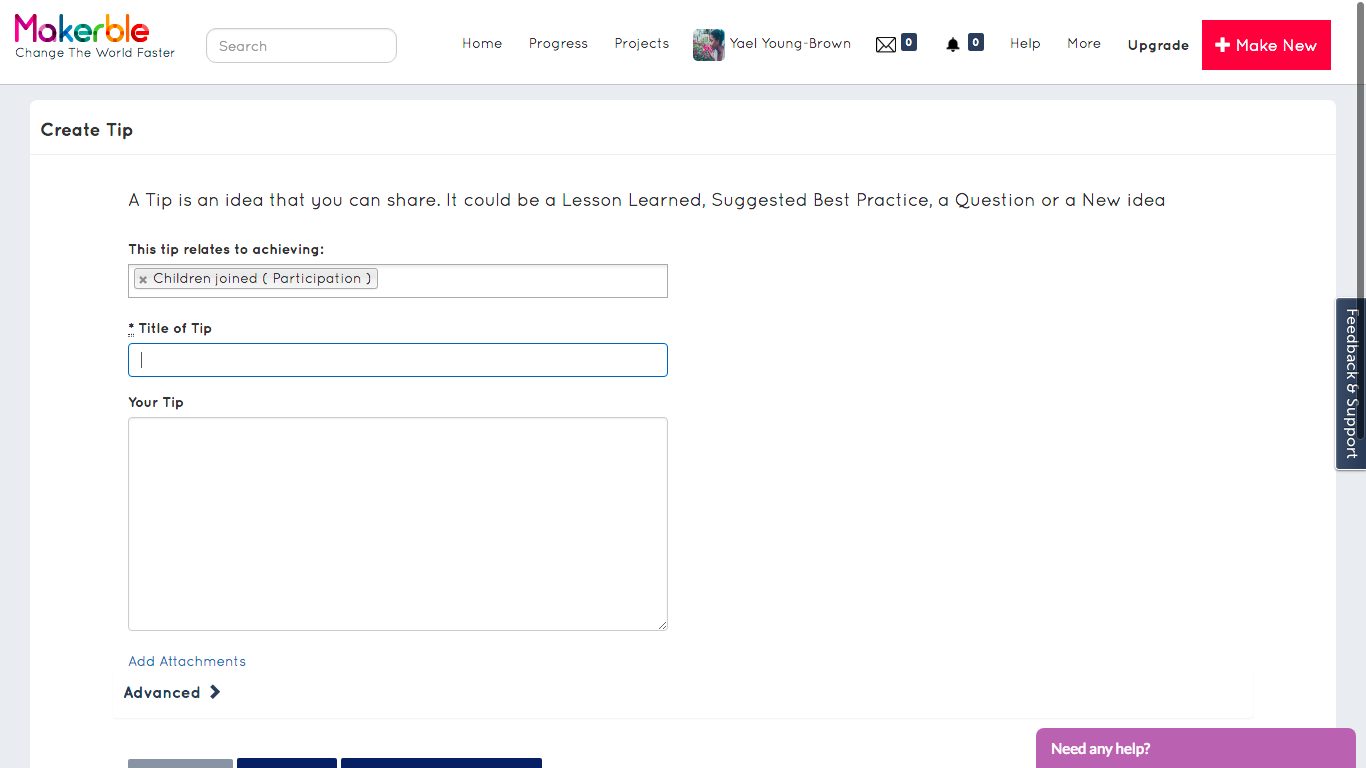
Upload pieces of best practice as “Tips”: add files, resources, website links, images, videos as well as text
Set your own approval rules - e.g. whether Tips from staff need to be moderated before they are published
Tag each Tip to make it contextually relevant. Tags include:
Outcomes, Indicators and Activities
Demographic groups
Geographic regions
Any other consideration that is relevant to your work. You can create your own tags.
Team members can opt-in to receive notifications of new Tips published which are relevant to the indicators they themselves are working to achieve
Book A Demo
Book A Demo to find how Impact Analytics could help you report on and better understand your impact

