
HUMAN CENTRED DESIGN
Human Centred Design sits across each of the 3 steps we take you through to increase the success rate of your programmes.

Step 1: Identify ‘Black Box’ Metrics
Identify the hidden unmeasured metrics that drive success and value for money
Workshops with staff, volunteers, clients
We use Theory of Change, Customer Journey Mapping and Process Diagrams to highlight your hidden metrics
Frontline staff typically have more expertise than they realise so we involve them in the process of identifying hidden metrics
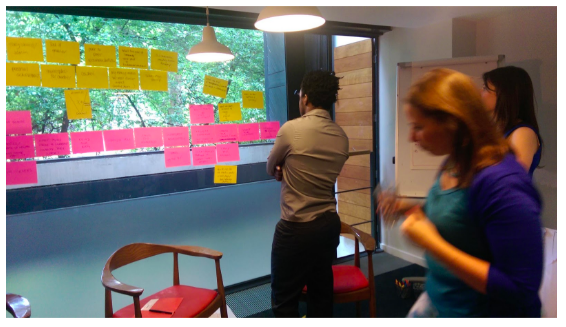
Our plain-english workshops put staff at all levels on a level playing field where they are free to share their insights and observations about what makes your work, work.

Primary Research with each set of stakeholders
Stakeholder Mapping
Focus Groups
Interviews
Surveys

Outcome Frameworks that demonstrate change
Theory of Change development
Creating logic models
Agreeing short, medium and long-term outcomes
Identifying the barriers to impact being achieved and creating a strategy that overcomes them

Step 2: Data Collection Processes Systems Culture
Supporting the transition from strategic thinking to operational implementation

Identifying Indicators which illustrate impact
Setting quantitative numerical metrics, e.g. people rehomed or money saved
Creating qualitative scales which enable Distance Travelled to be calculated
Deciding a frequency at which each indicator should be collected
Building a bank of indicators and setting the terms for which indicators are relevant in each scenario
Definitions and criteria for each indicator and threshold
Identifying sensitivities to be aware of when collecting certain pieces of data

Designing mutually enjoyable data collection experiences
Data collection does not need to be dull
We can redesign your onboarding assessments so that they continue to capture the essential information whilst feeling relevant and insightful for the person providing their information

Technical Guidance on collecting & storing data
Data flow and process diagrams
Identifying and designing appropriate data collection systems
Integrating data from multiple sources into local and global-level dashboards

Embedding feedback loops
Create a culture of iteration
Internal comms campaigns to show the value of feedback loops
Training sessions which show the benefit of a ‘fail fast’ iterative approach

Step 3: Reporting, Insight and Innovation
Find the meaning in the data which acts as an early warning system or a driver of user-focused innovation

Innovation & Service Design
Workshops to unearth insights from your data
Human Centred Design methods to rapidly prototype new solutions
Apply to Service Design to reshape the way beneficiaries engage with you
Apply to Marketing to change the way your audiences think about you
Talk to us for a no-obligation conversation around your current challenges