
International development
Use Makerble for Monitoring, Evaluation, Research and Learning
Makerble Apps are an end-to-end reporting solution that gives you the ability to embrace the principles of adaptive development
THE MAKERBLE APPS
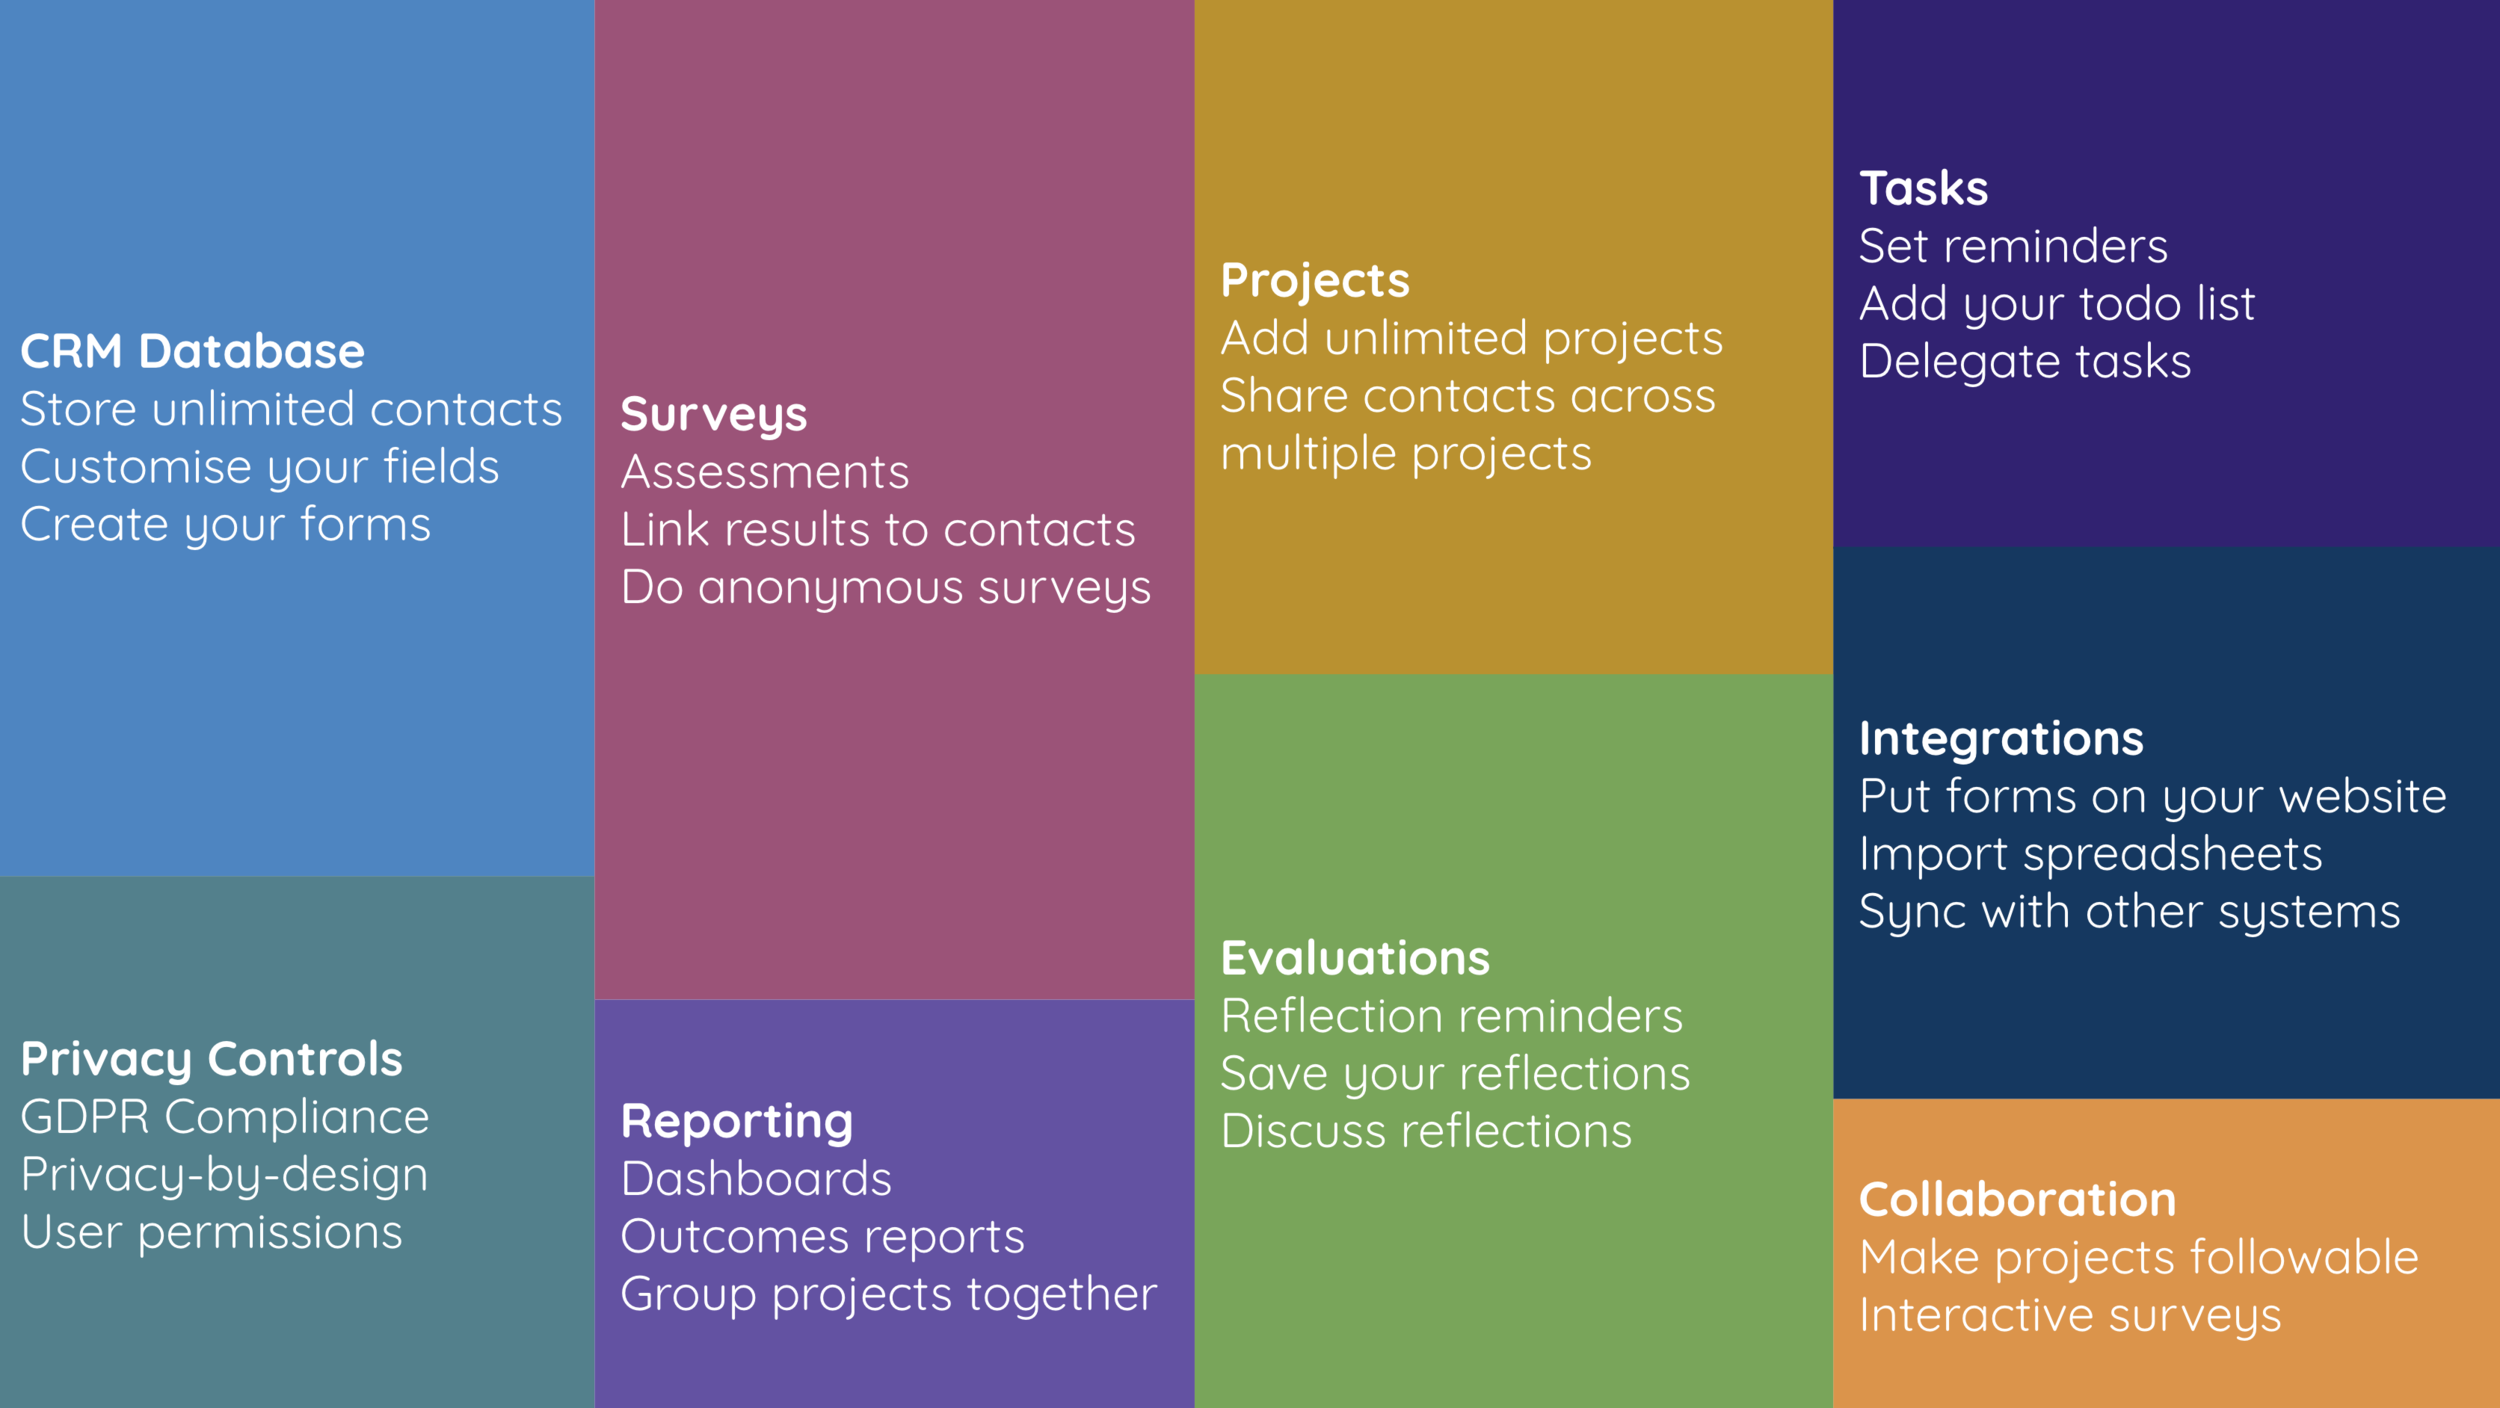
Makerble Apps can be used standalone or as an integration with databases you already use, whether that’s Salesforce, ThankQ or something bespoke.

Design: Create your own logic models
Whether you use Theories of Change, Log Frames or Logic Models, you can design your programme’s data collection approach within Impact Analytics. Create your own:
Logic Model templates which you can reuse across different programmes
Outcomes with associated indicators
Indicators whether they are Binary, Numerical or based on Qualitative Scales
Surveys

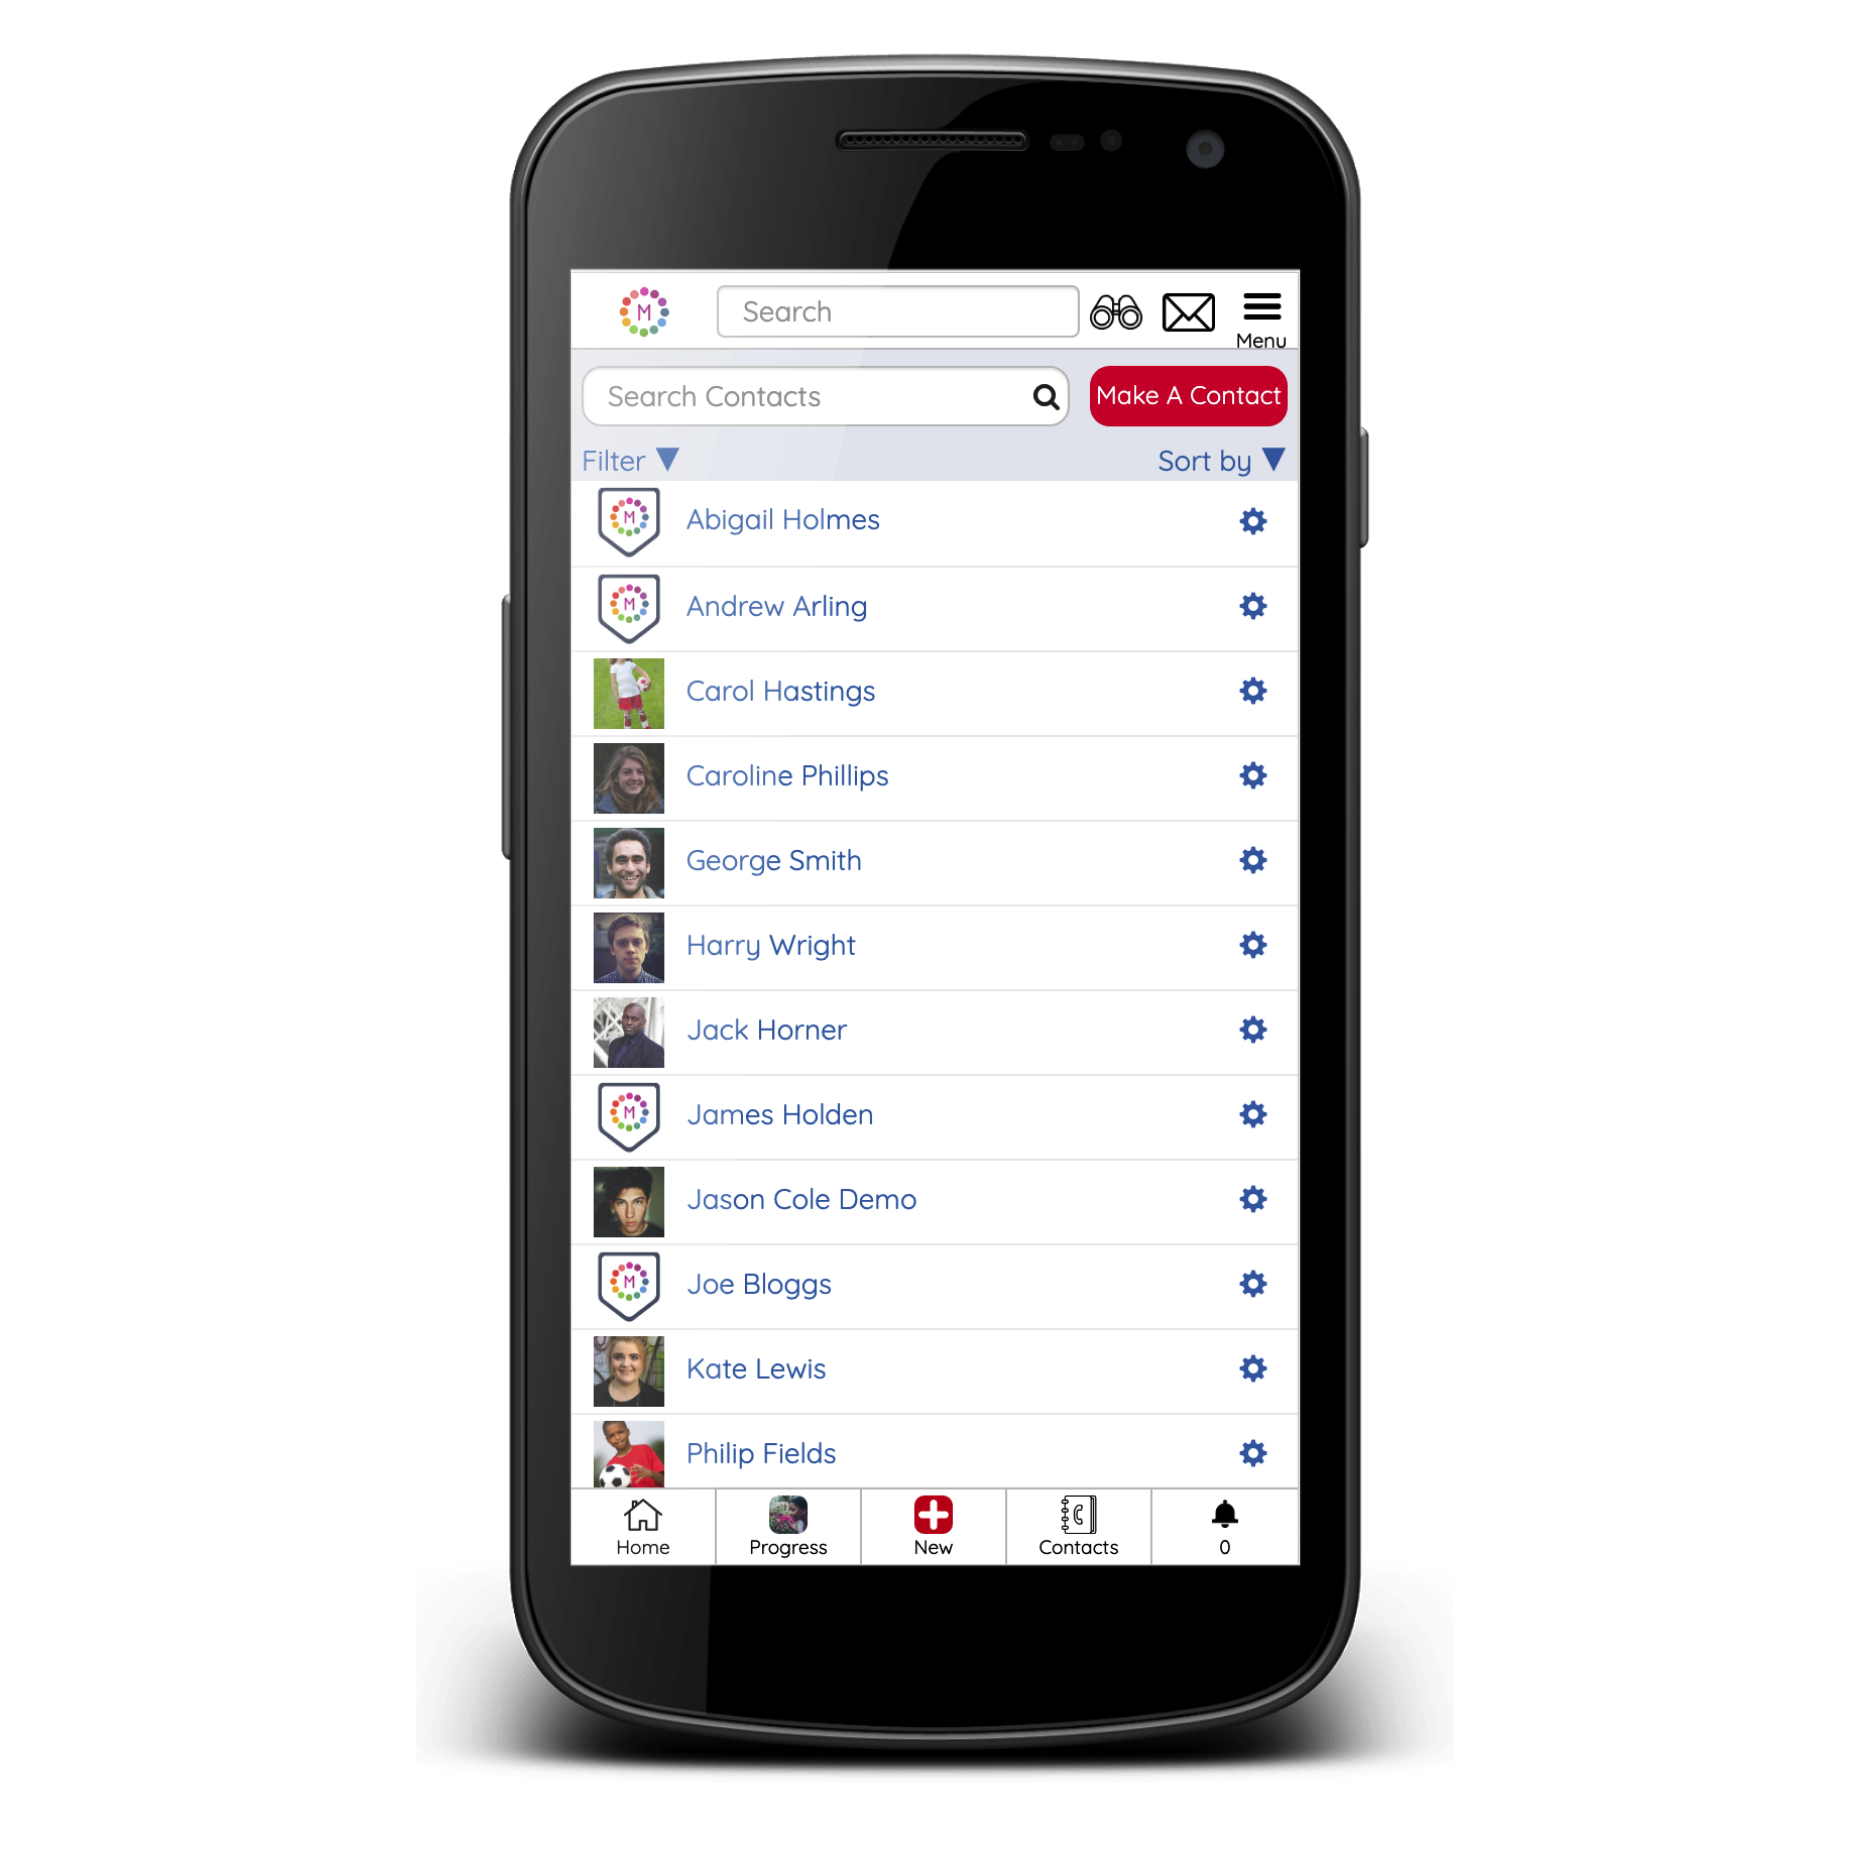
Data Collection: Offline mobile app and cloud-based web portal
The Impact Analytics Android App can be used offline to complete a variety of forms which you can design. The app automatically imports your choice of indicators from your logic model.
Register new beneficiaries
Report on indicators and activities at a group level, e.g. 30 people vaccinated
Report on indicators at an individual level, e.g. Joseph was vaccinated
Conduct surveys and scored assessments - both anonymous and assessments that are linked to individuals. Collect multiple choice responses, soundbites, videos, pictures, free text and files attachments.
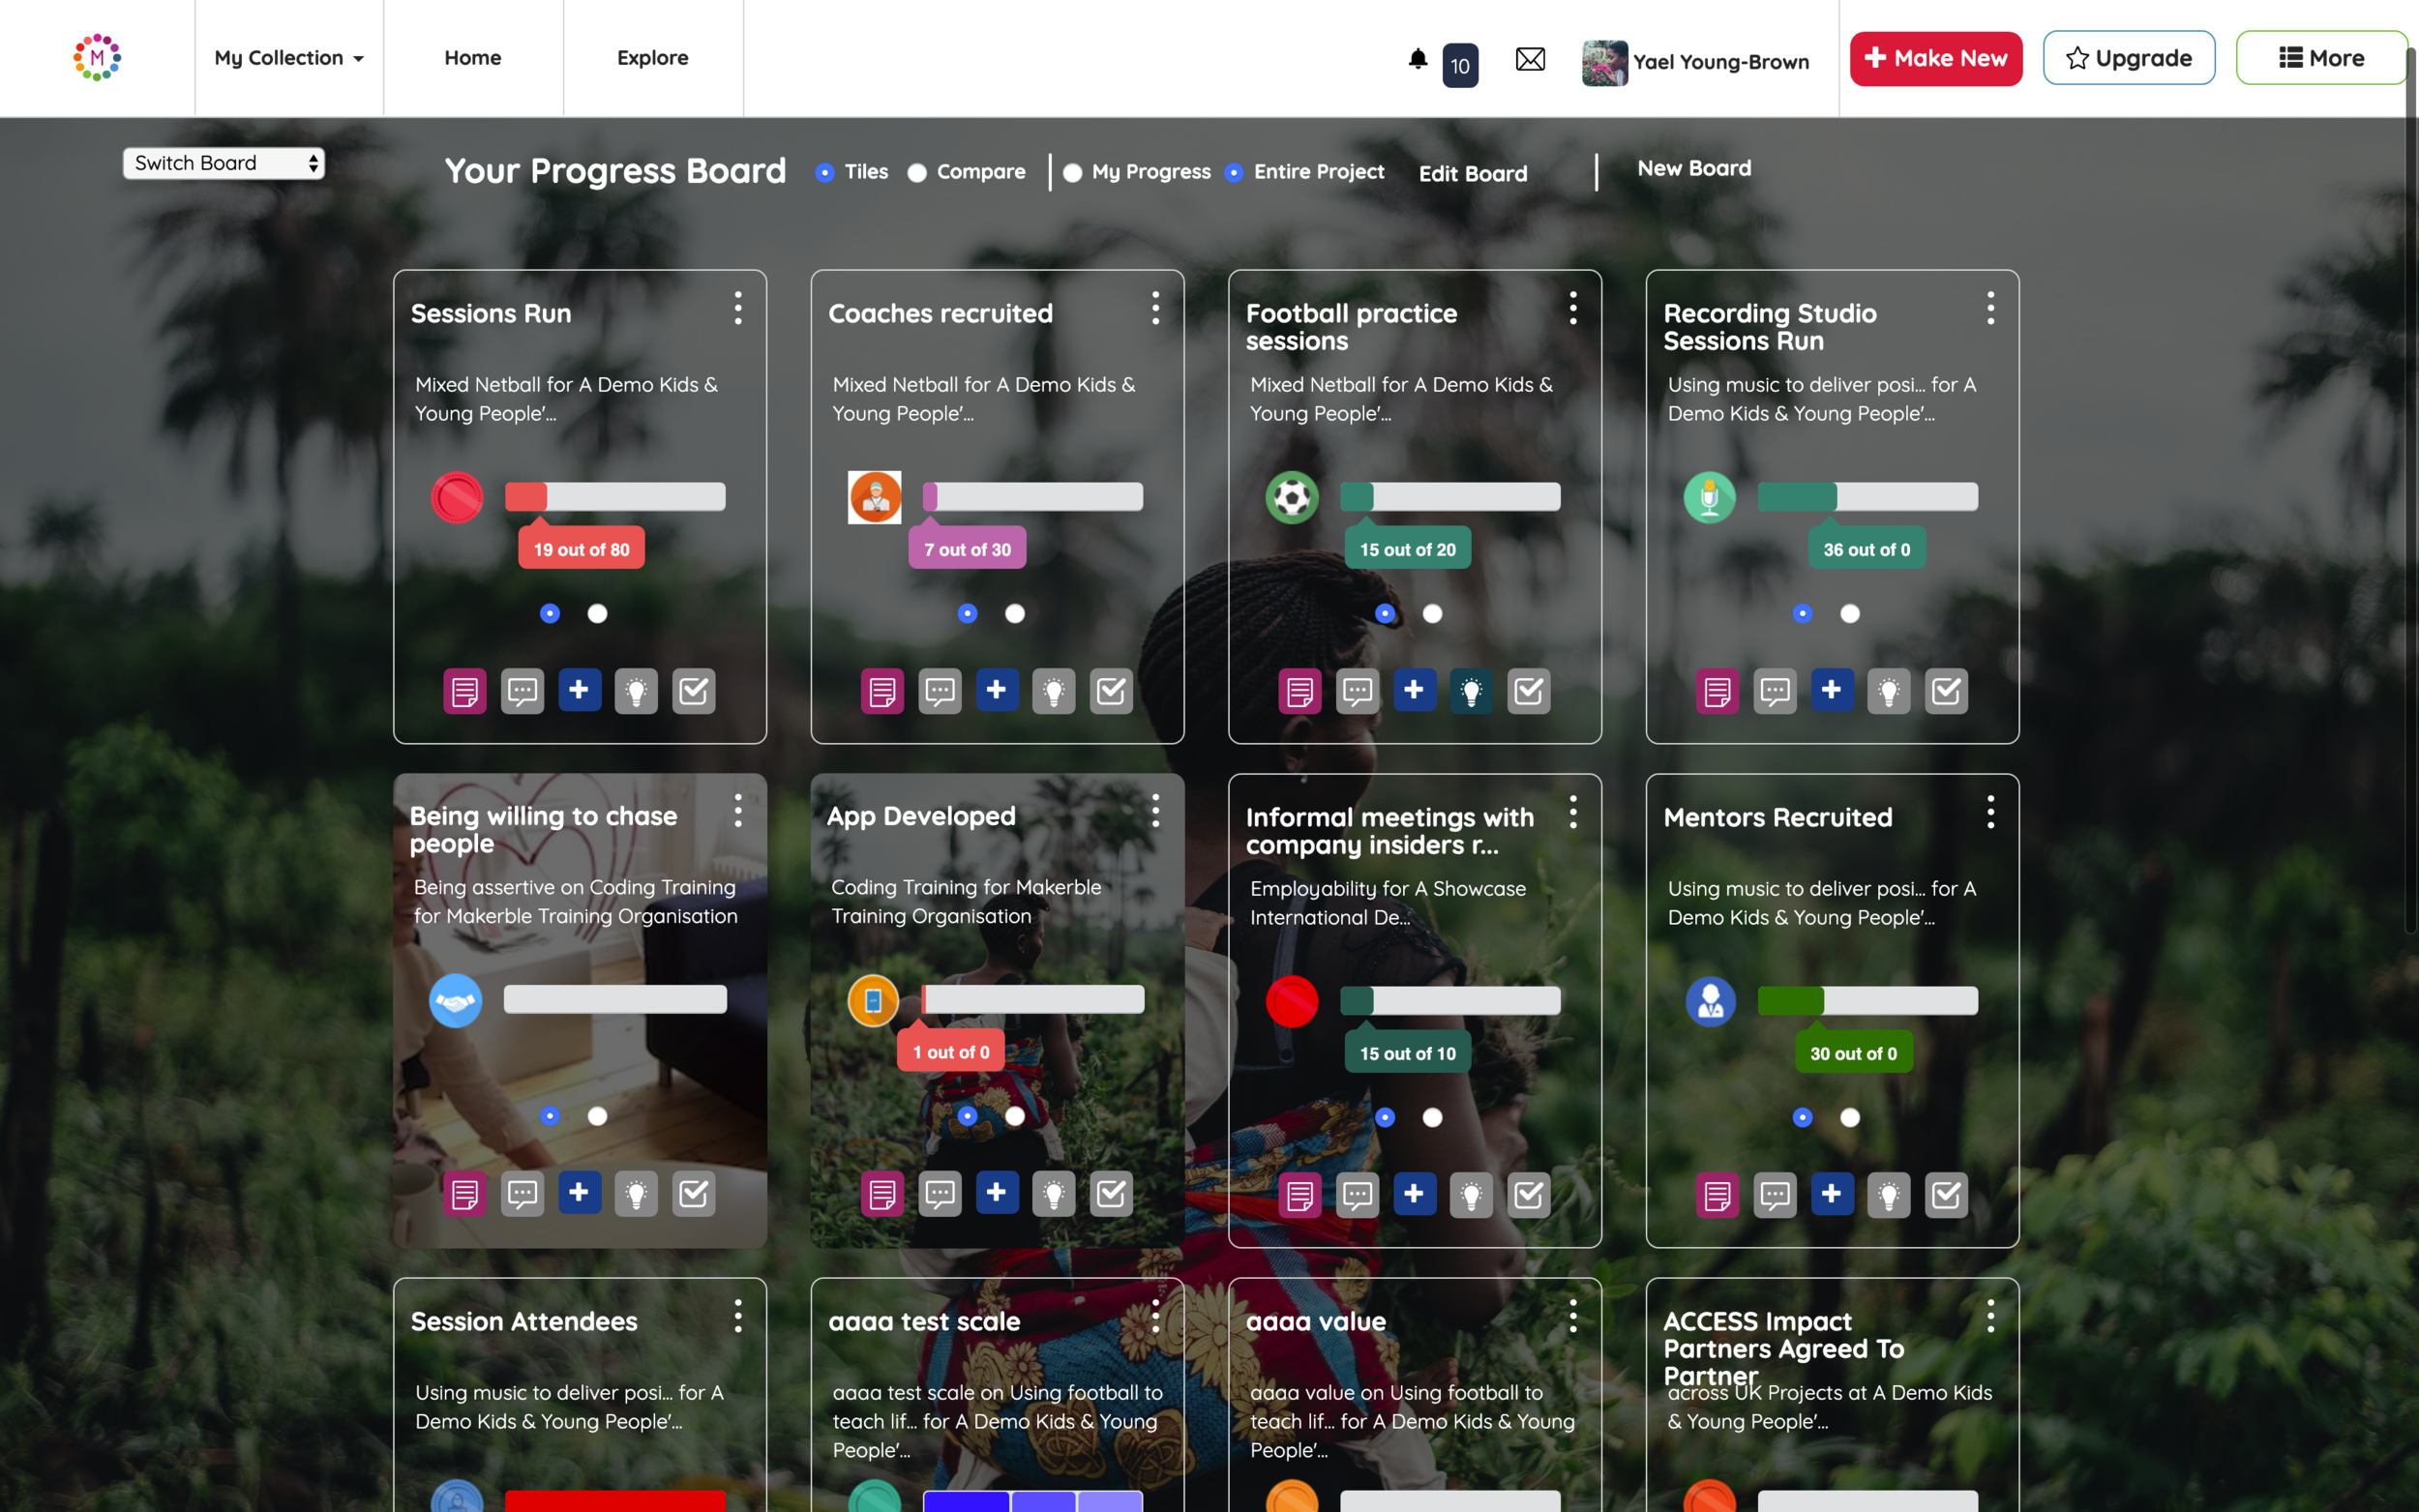
Monitoring: Real-time progress based on data from anywhere
Group projects into “bundles”. Projects exist within multiple bundles so you can easily create bundles for each:
funder you report to
region you work in
or theme you work on
Create alerts for when progress slips behind schedule.
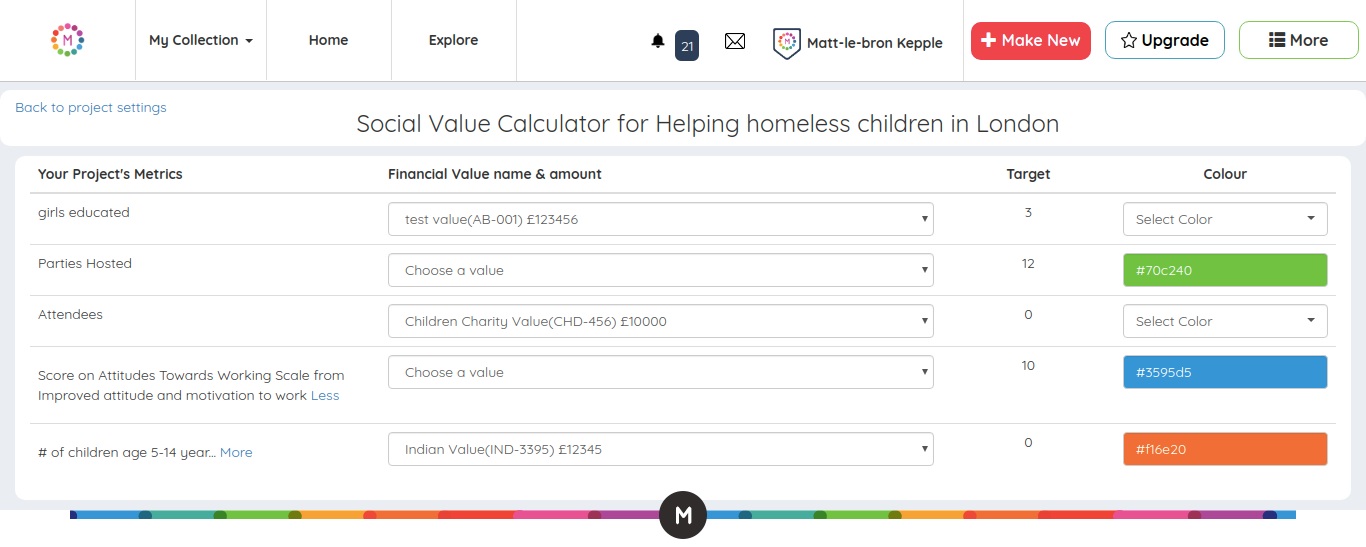
Proxies: Aggregate project-level metrics into portfolio-level metrics
The in-built calculator allows you to define the rules for setting proxies. Aggregate multiple indicators into one e.g. “Women rehomed”, “Men rehomed” and “Children rehomed” into “People rehomed”. You can also use it to automate your calculations of Social Return On Investment, Social Value or any other numerical value of social impact.
Reporting: Use your data to show Distance Travelled and more
Segment your results by Age, Gender, Ethnicity or any segmentation of your choosing. Impact Analytics has an inbuilt audit trail which enables you to see the original data that your results are calculated from at any time.

Qualitative Coding: Add labels to stories, field notes and updates
Create your own labels
Share labels across colleagues or use them privately
Use labels to code your qualitative data, whether it’s case studies, case notes, updates or other files

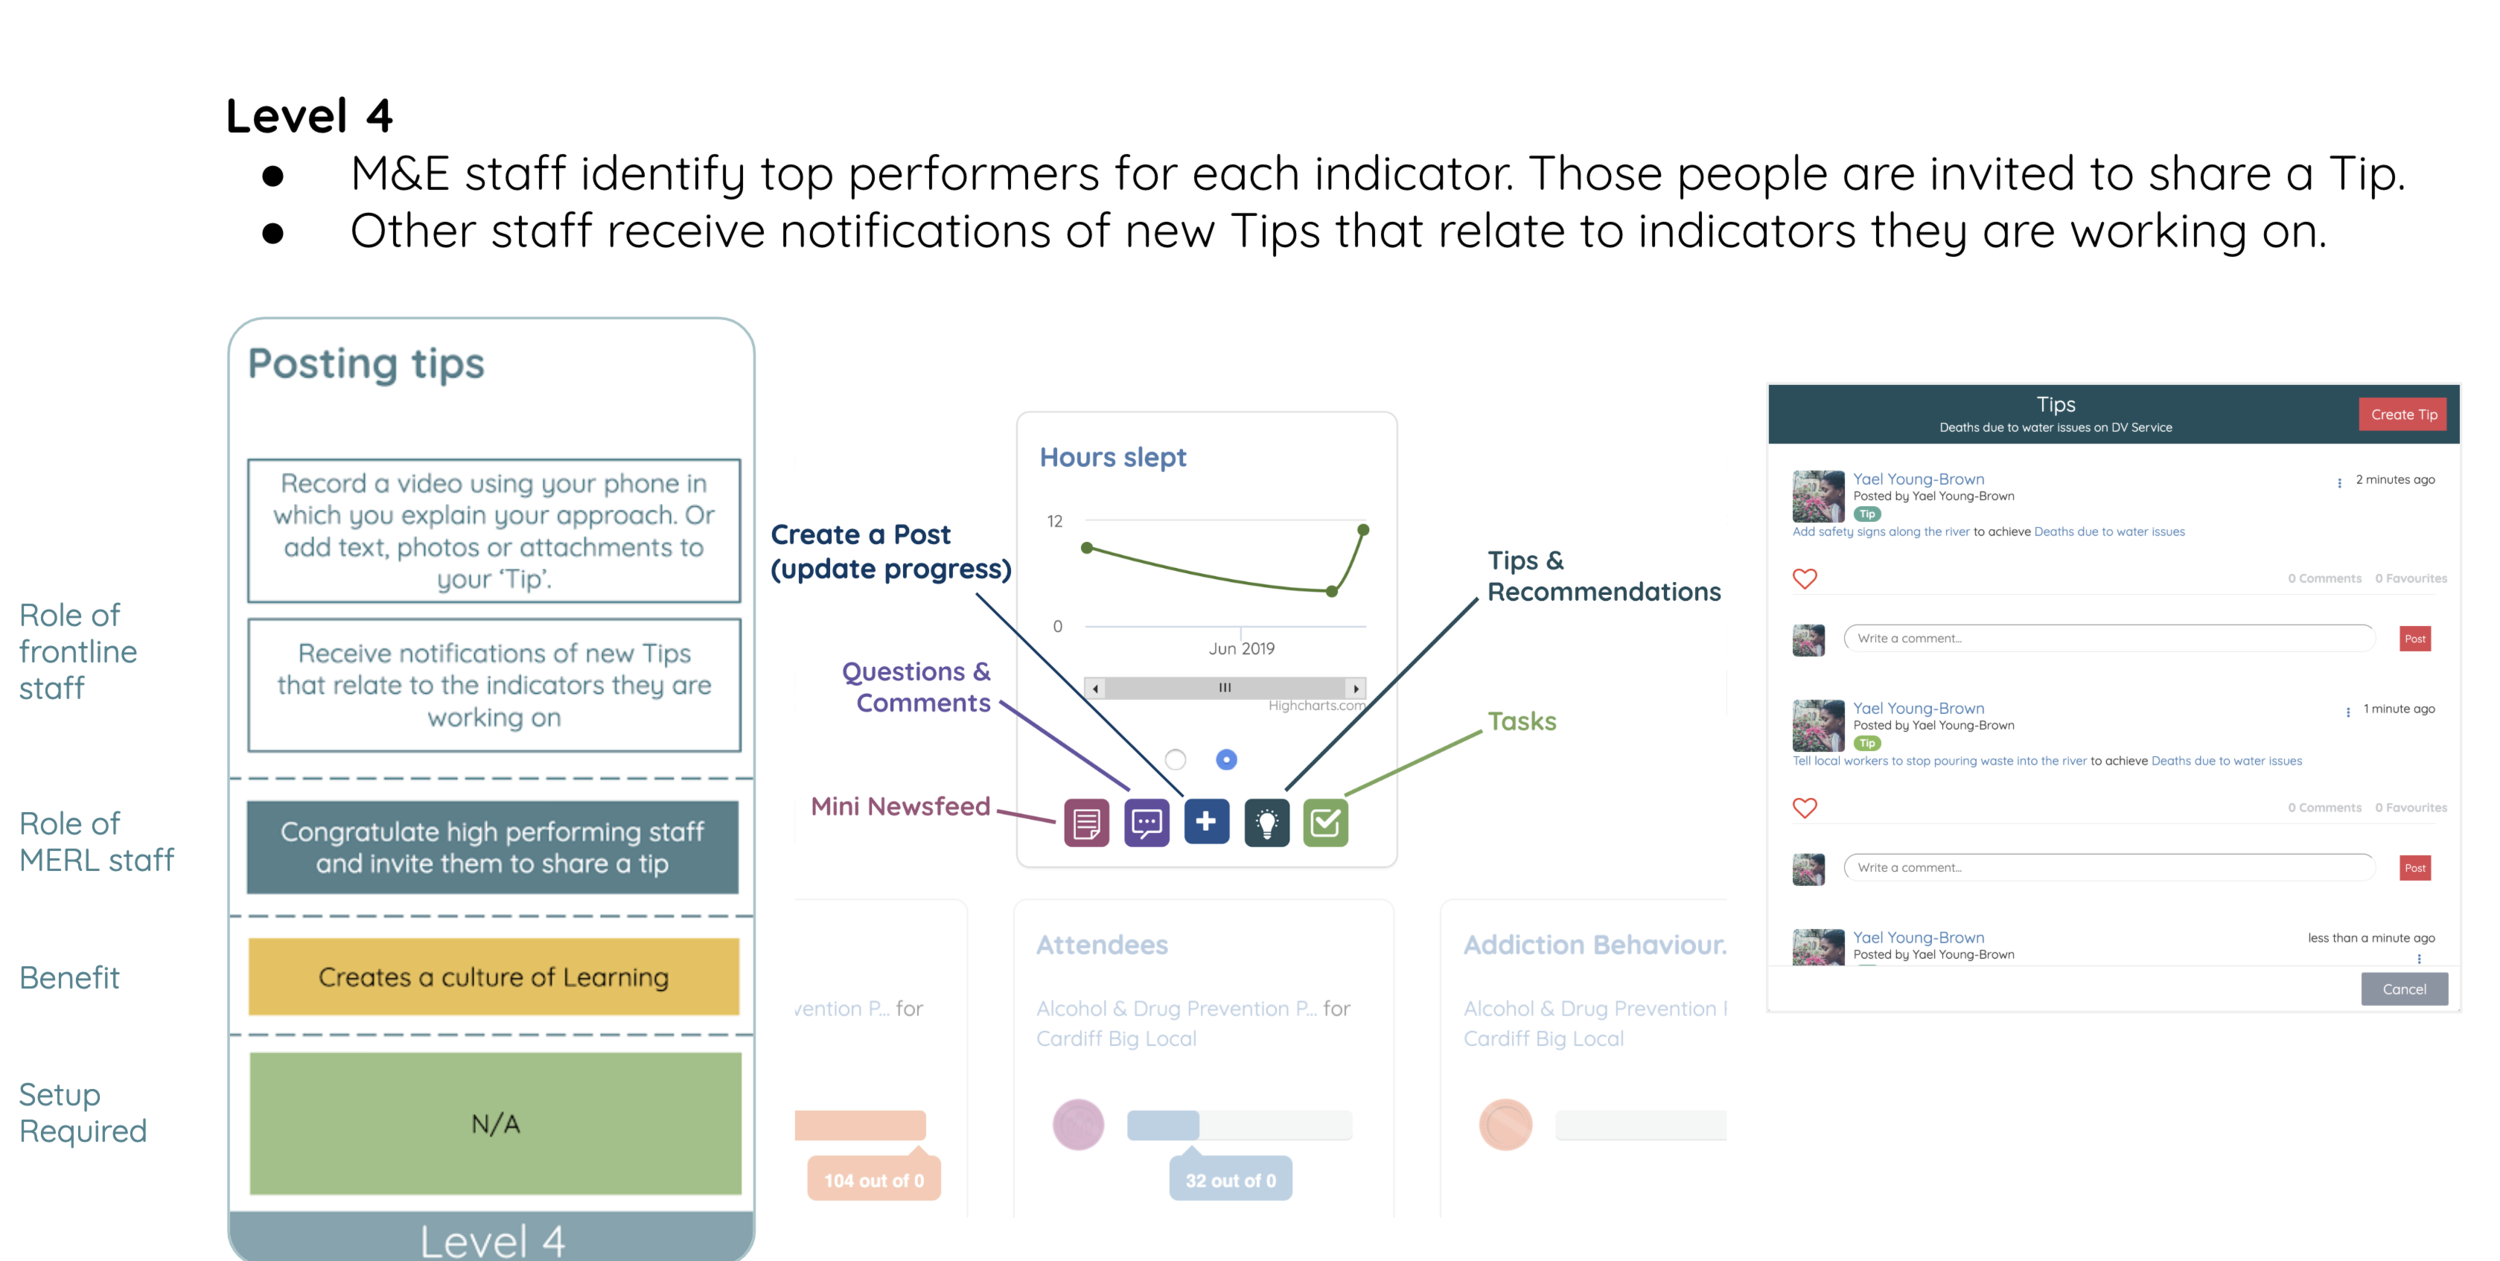
Learning: Make best practice easily discoverable and directly applicable
Create a constantly updated repository of best practice which everyone on your team can contribute to, comment on and access directly within Impact Analytics.
Upload pieces of best practice as “Tips”: add files, resources, website links, images, videos as well as text
Set your own approval rules - e.g. whether Tips from staff need to be moderated before they are published
Tag each Tip to make it contextually relevant. Tags include:
Outcomes, Indicators and Activities
Demographic groups
Geographic regions
Any other consideration that is relevant to your work. You can create your own tags.
Team members can opt-in to receive notifications of new Tips published which are relevant to the indicators they themselves are working to achieve

Workflows: Integrate with other tools
Impact Analytics is a cloud-based tool with a suite of APIs which can connect to a range of data collection tools, databases, reporting tools and operational tools.

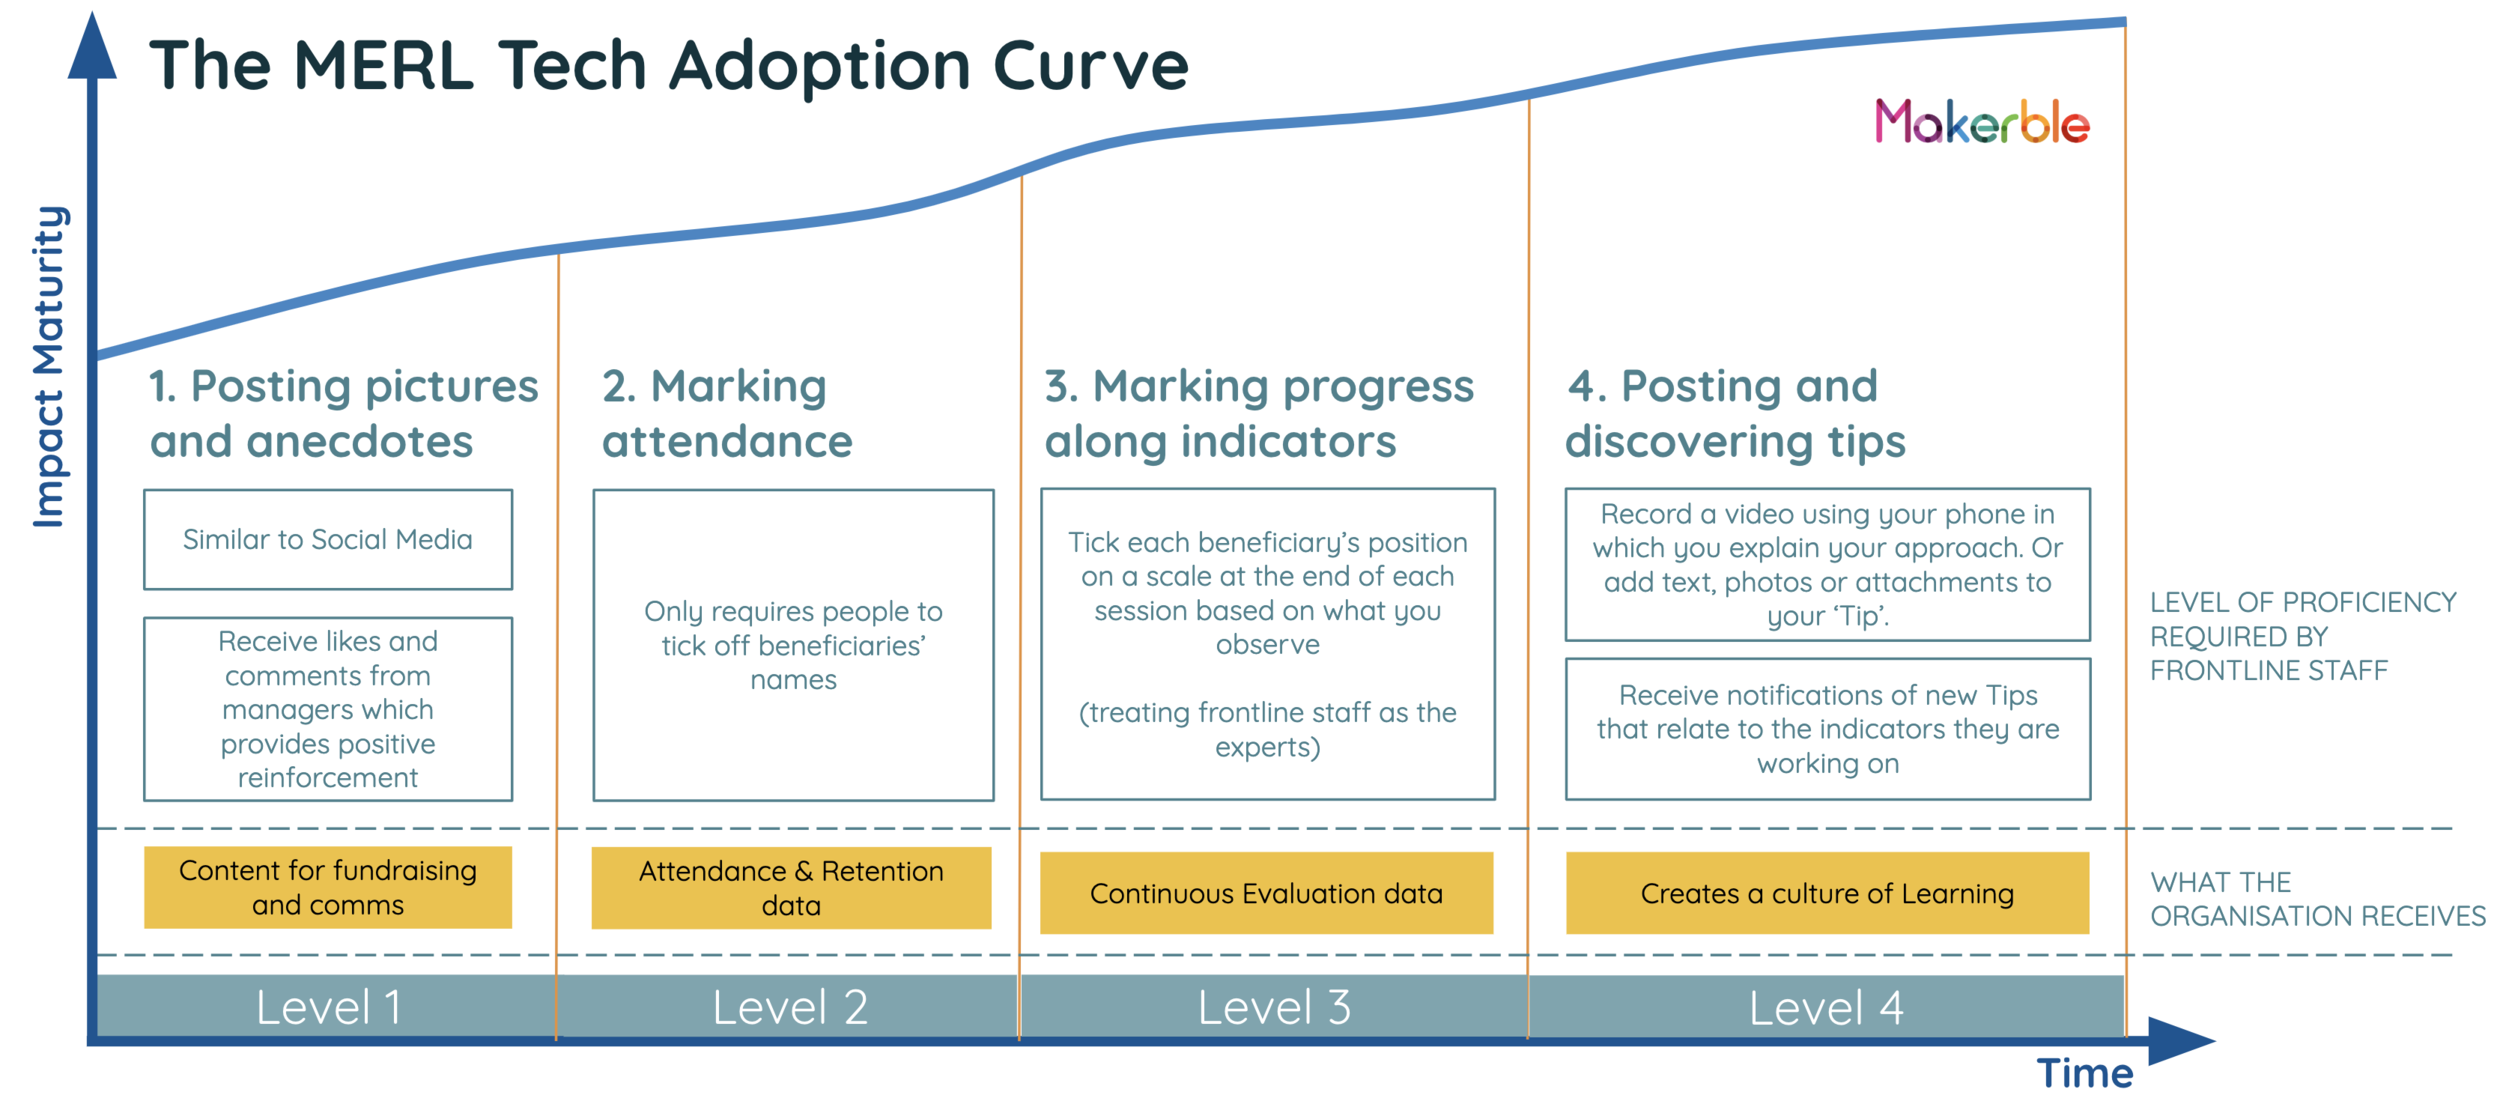
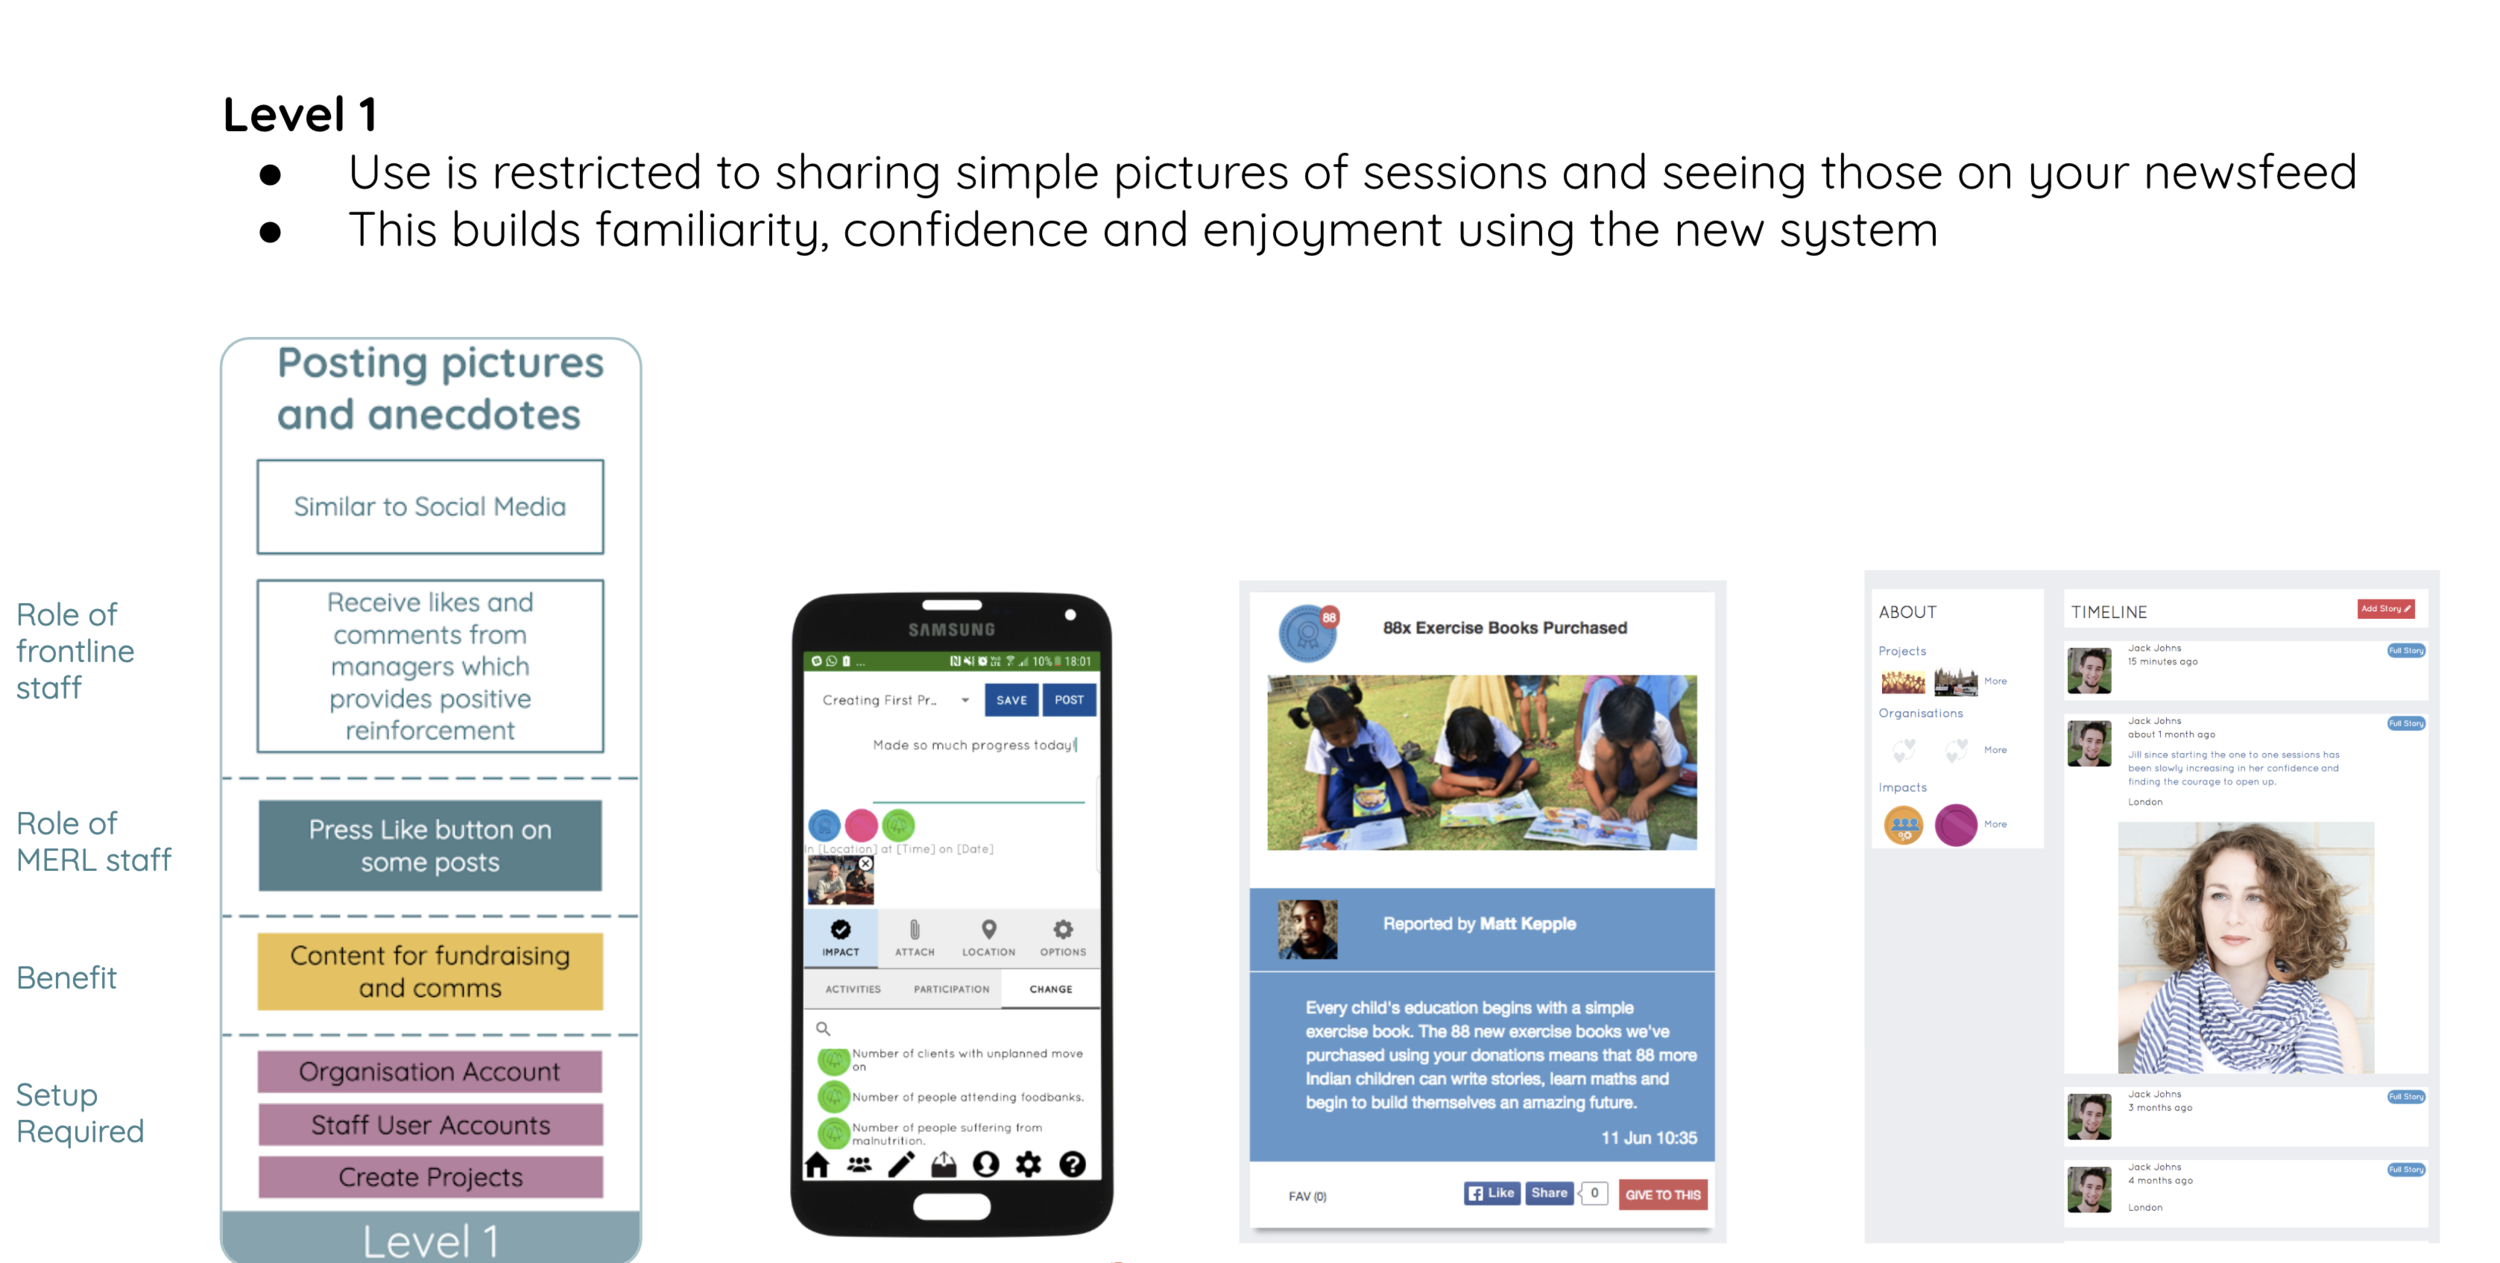
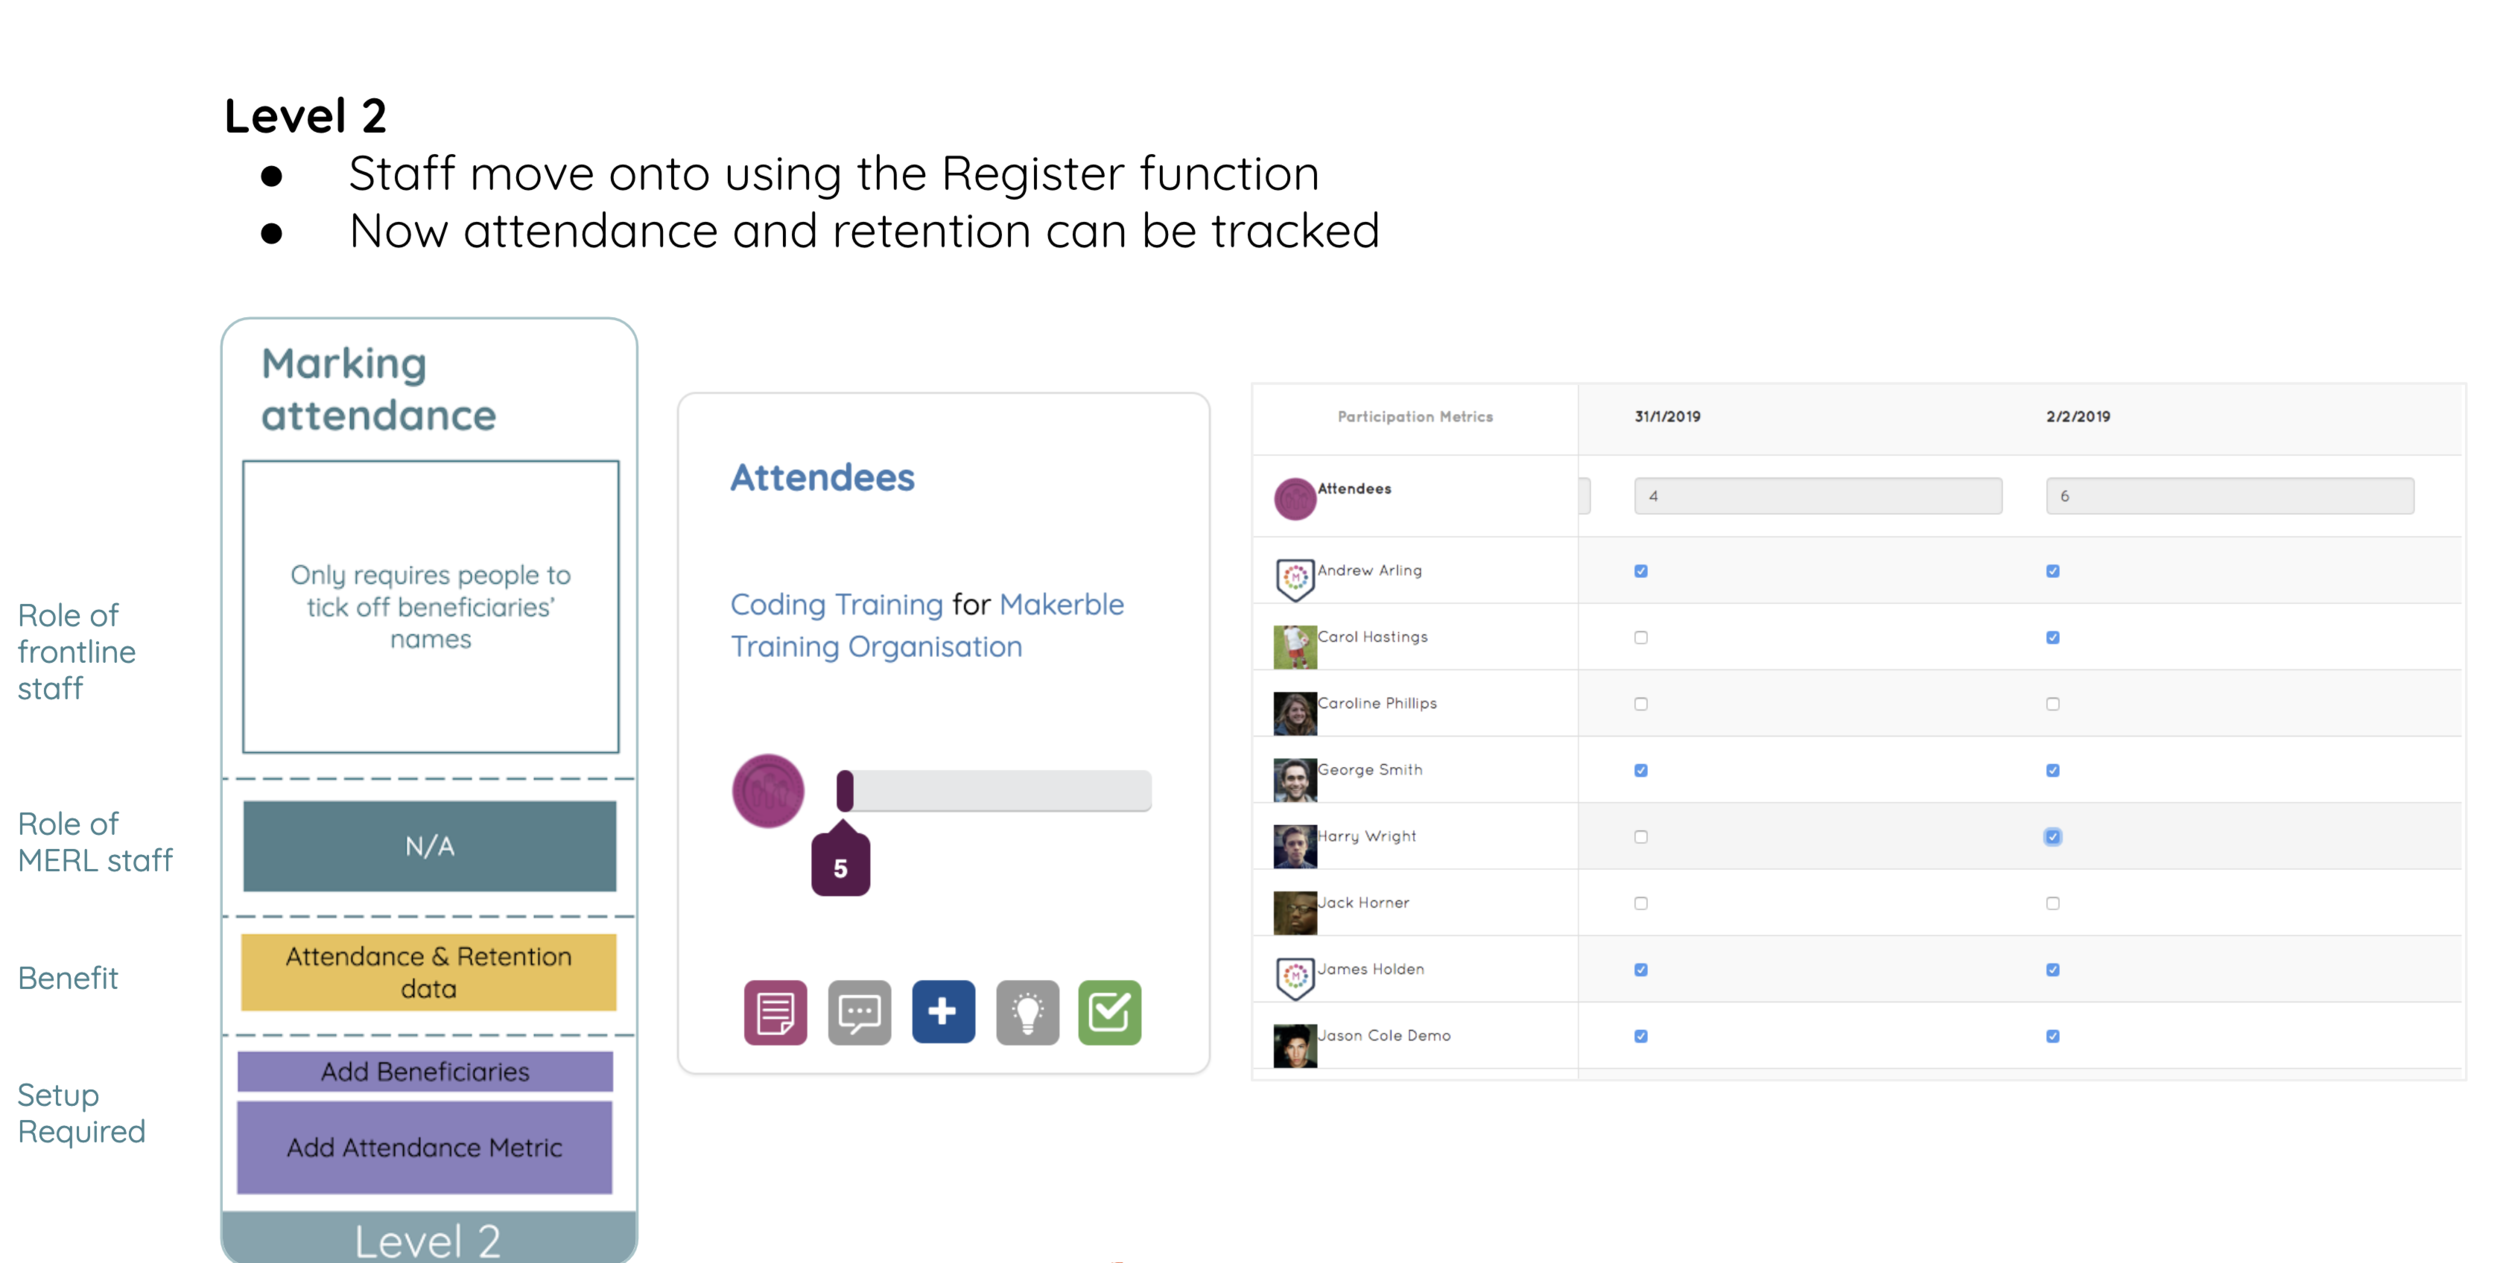
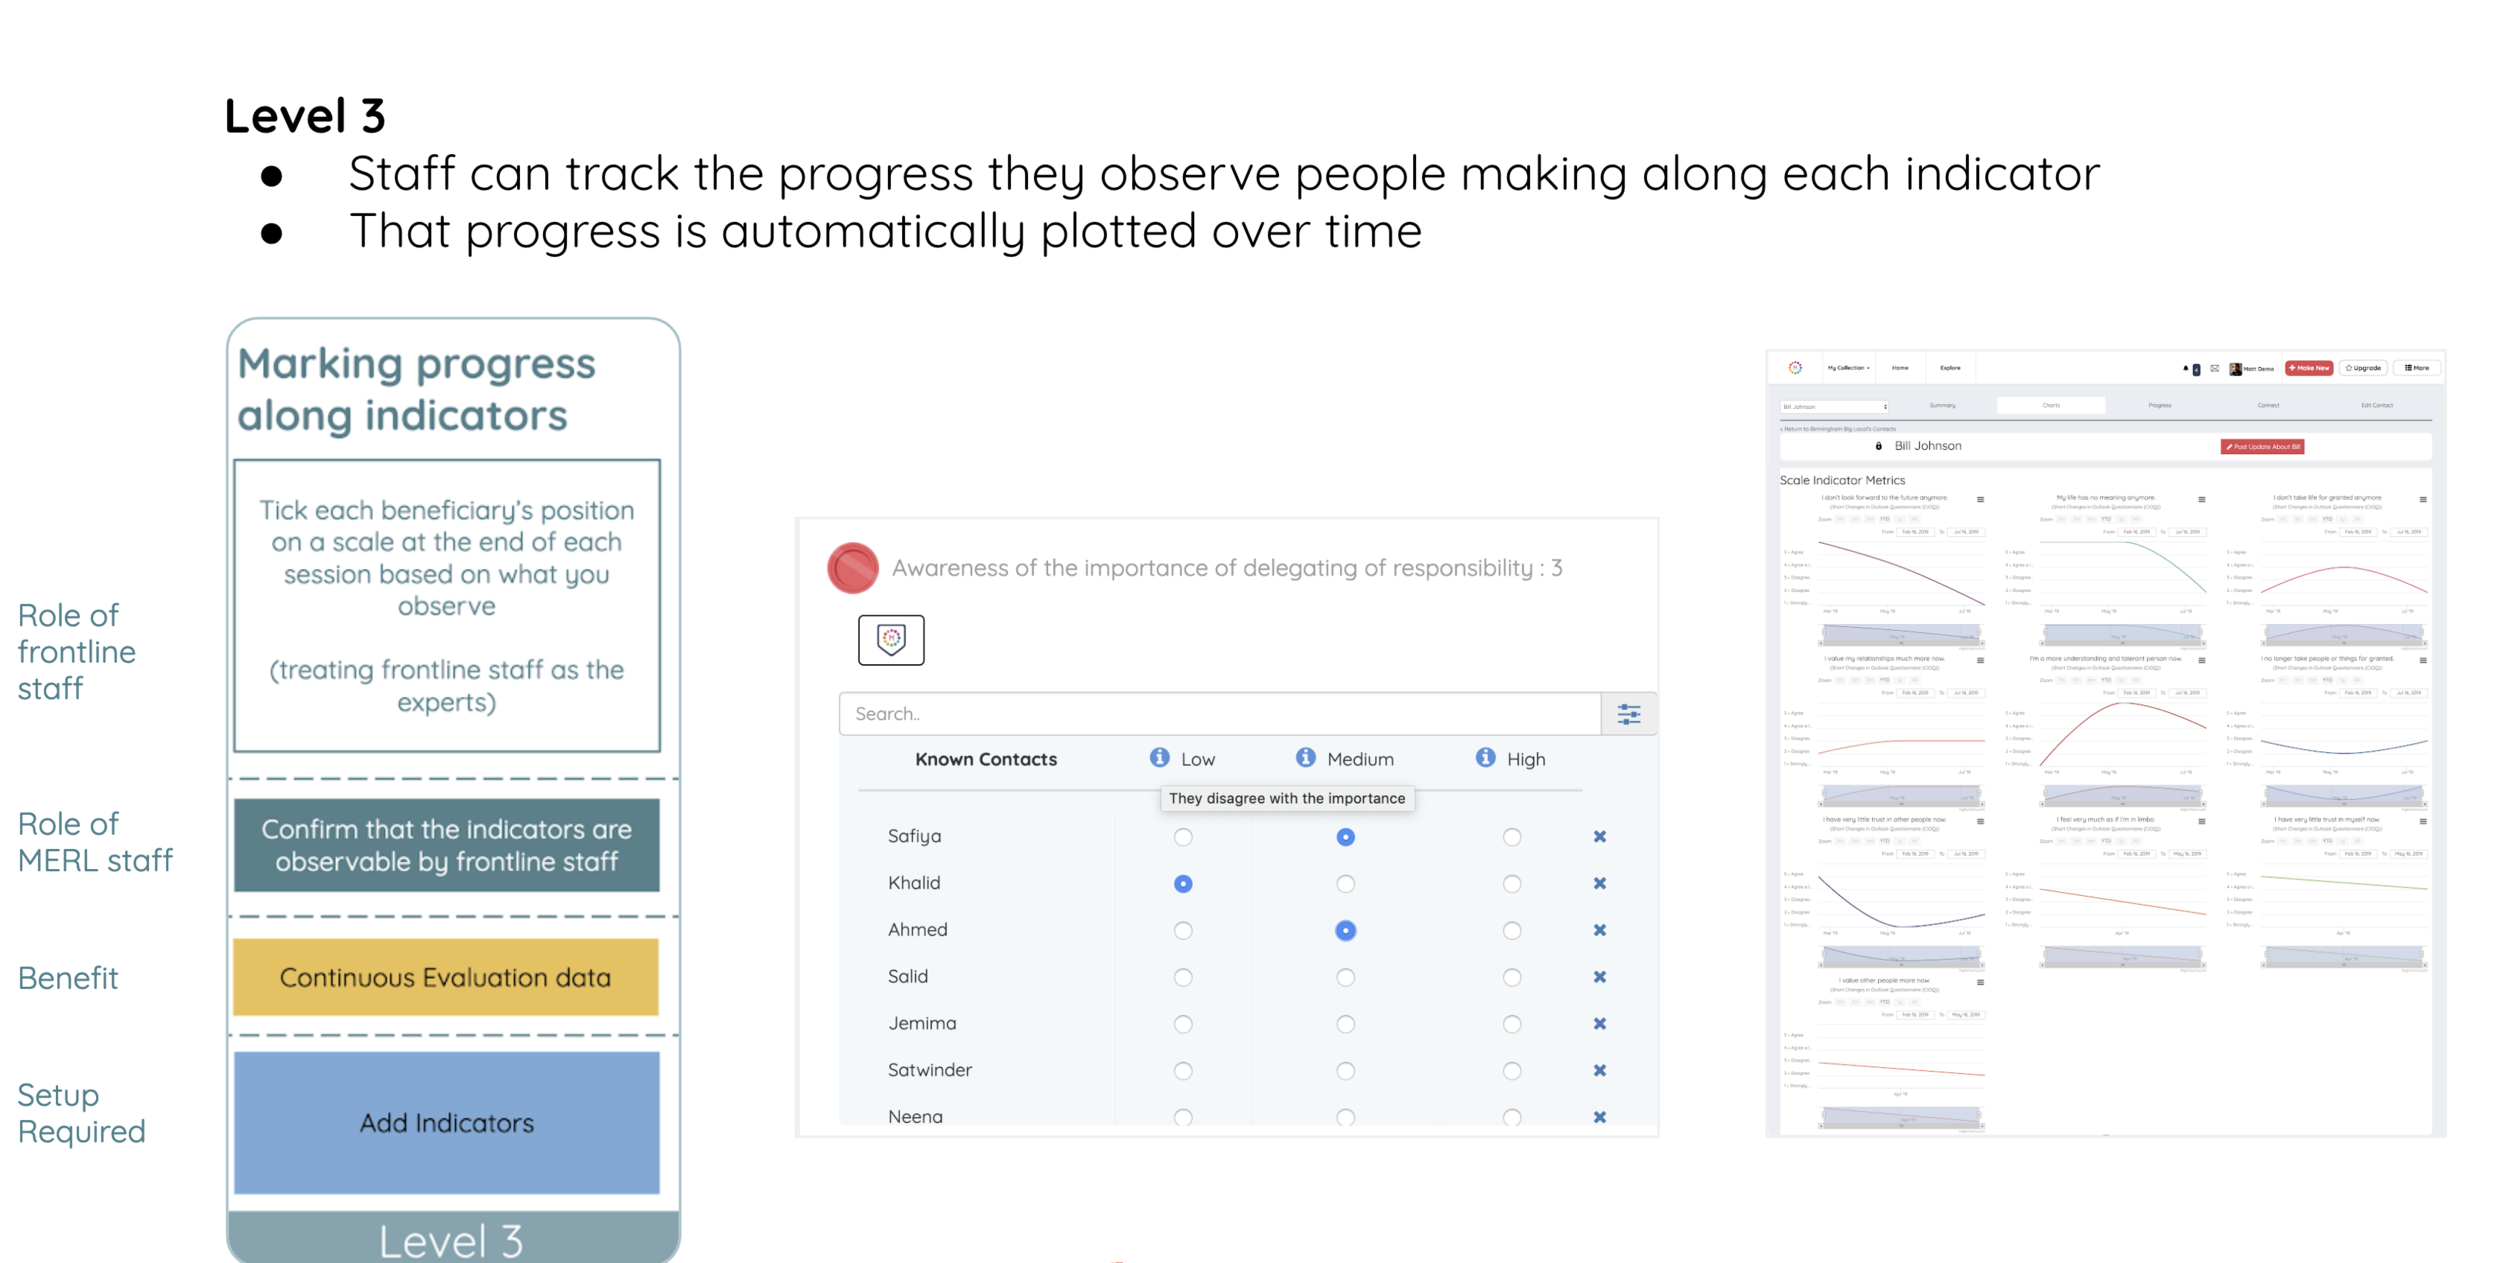
Onboarding: A realistic approach to ensuring adoption by colleagues
As well as providing in-person training, online webinar training and a suite of training manuals, PDFs and walkthrough videos, we take a systematic approach to rolling out your digital MERL platform so that your colleagues can gradually become familiar with using a new tool.
Book A Demo
Book A Demo to find how Impact Analytics could help you report on and better understand your impact

