Bristol Green Capital Partnership secured £2.5million in funding after using Makerble to demonstrate the impact of their pilot programme to The National Lottery Community Fund’s Climate Action Fund. Find out how the partnership uses Makerble to remove paperwork and avoid getting tied up in spreadsheets.
The Trussell Trust use Makerble to understand the effectiveness of their foodbanks
Spadework use Makerble to record their day to day impact
Somerset West and Taunton Council choose Makerble to manage their employment hubs programme
Case Study: Engineers Without Borders
SurveyMonkey alternatives: Makerble versus SurveyMonkey
SurveyMonkey is a way to collect survey responses
Case Management
SurveyMonkey is not a case management tool.
This means that in order to use SurveyMonkey, you have to maintain a separate system to manage your day to day work with clients, beneficiaries and stakeholders
If you want to use surveys to understand your impact, you will have to copy & paste some data between your spreadsheet and SurveyMonkey.
This is inefficient, takes up precious time and is susceptible to human error.
Distance Travelled
SurveyMonkey is designed to give you a show you the results from a single survey campaign. It is not designed to compare individual people’s survey results over time.
On Makerble, every respondent has a profile
This means that Makerble can automatically detect their pre-programme, mid-programme and post-programme responses to each question and instantly report the improvement over time for each individual beneficiary but also for the cohort as a whole
There are no insights beyond the questions in your survey
SurveyMonkey only looks at the answers to survey questions
It does not take into account the operational information you have about your beneficiaries
Because you cannot cross-reference your survey data with your operational data, it means that you miss out on valuable insights.
Example
If you are a therapy nonprofit, your case management system shows the demographic makeup of your clients and the number of sessions they attend. By cross-referencing this with your client’s survey results (which you can do in Makerble), you could see that:
people who attend between 5 & 10 sessions tend to be those that see the biggest improvement
Black girls aged from 14 to 17 tend to underperform versus the average
Everyone who is counselled by Therapist X tends to see a bigger change over time
Those kinds of insights that tell you about the audiences you're under-serving are only possible when you're able to cross-reference survey responses with operational data about how often you see people, who sees them, demographic details about those people, who referred them, etc.
Conclusion
Whilst SurveyMonkey is a powerful surveys tool, it stops at surveys.
Whereas on Makerble you will get the context that helps you understand your survey results
5 things that happened in the Charity sector this week - 23rd April
5 things that happened in the Charity sector this week - 16th April
The difference between Outputs, Outcomes and Impact
5 things that happened in the Charity sector this week - 8th April 2021
How to persuade your team to move away from spreadsheets for evaluation
5 things that happened in the Charity sector this week - 26th March 2021
5 things that happened in the Charity sector this week - 19th March 2021
Case Study: Moving On Up
How to actually make more impact as a charity
Plan, do, review.
This is the dream of any good monitoring and evaluation process and the thing we all know, in theory, should happy regularly when delivering charity services. Especially when funds are tight, making services more streamlined and effective is good for everyone.
We all have good intentions around this but there are two key things that are quite often missing:
Good quality, reliable data
Easy to use reporting tools
Without these things, the review process becomes difficult and, in some cases, impossible.
So how can we actually close the loop and use what we know to improve charity services?
One way is to pay for a large scale evaluation project to take place, but what if that process could be simpler? What if decisions could be made more quickly, based on real time data that your team are motivated to collect.
Firstly, let’s talk about data.
There are two key things that make for excellent, quality data collection:
Easy to use data systems that make data capture a dream rather than a chore.
People who are motivated to collect data.
Without one of these two things, you will never have good data to work with. You can invest all the money in the world in a new system, but if your team aren’t motivated that system will quickly become defunct and full of unusable data or empty. You can also have the most willing team in the world, but without a good system in place, data collection can quickly become a chore. Let’s be honest, most people don’t work in the charity sector because they’re motivated by data collection, but it is a key part of the job, so making sure your systems are easy to use will help a lot. But a good system alone will never be enough to motivate everyone, but there is a secret tool that can help.
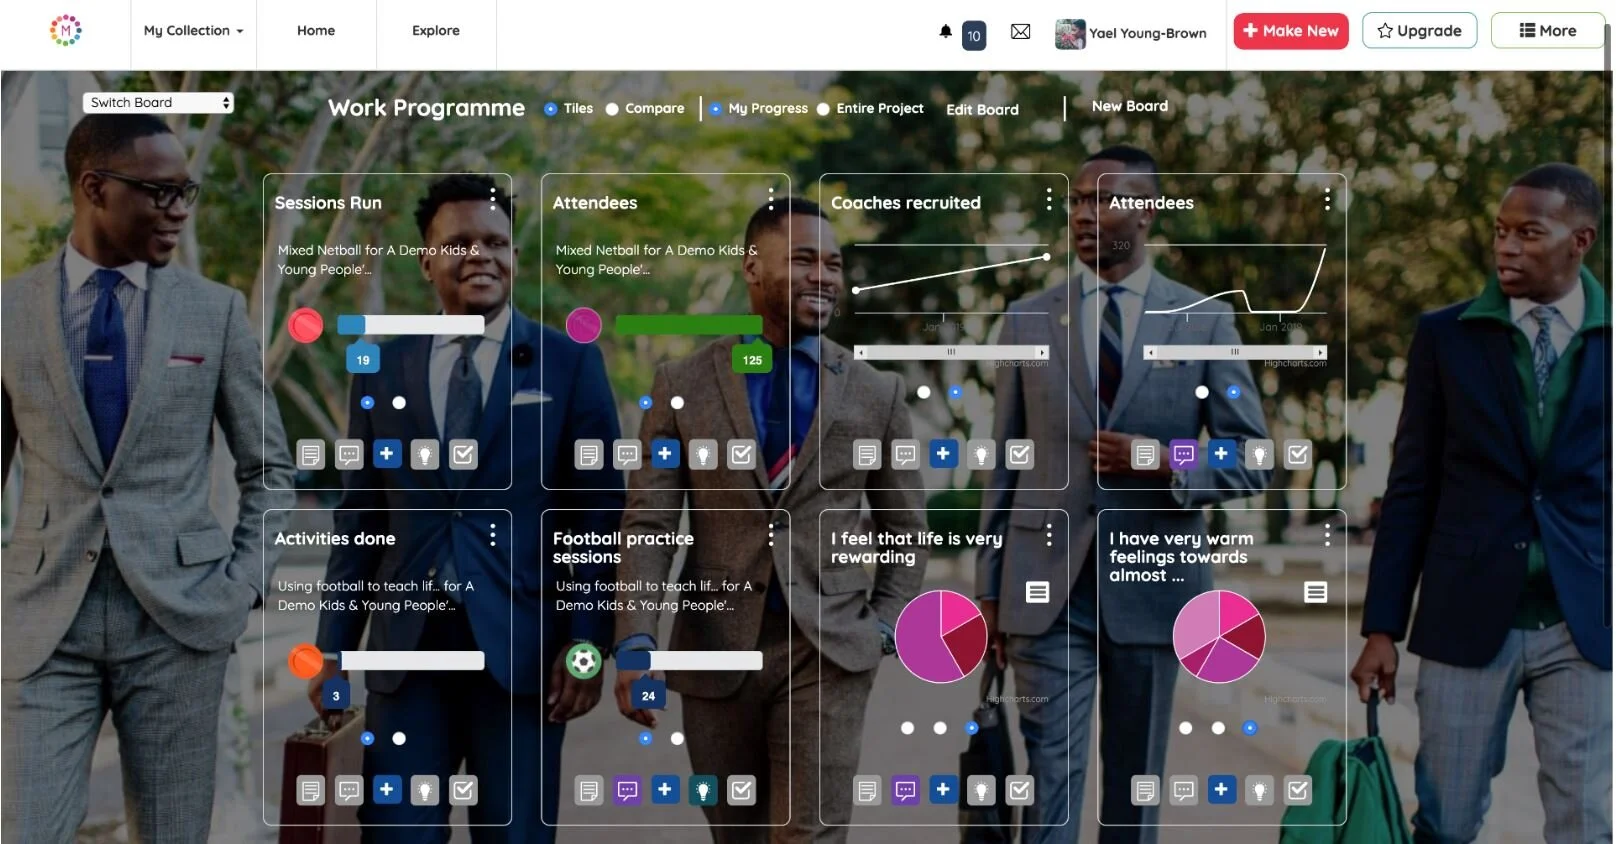
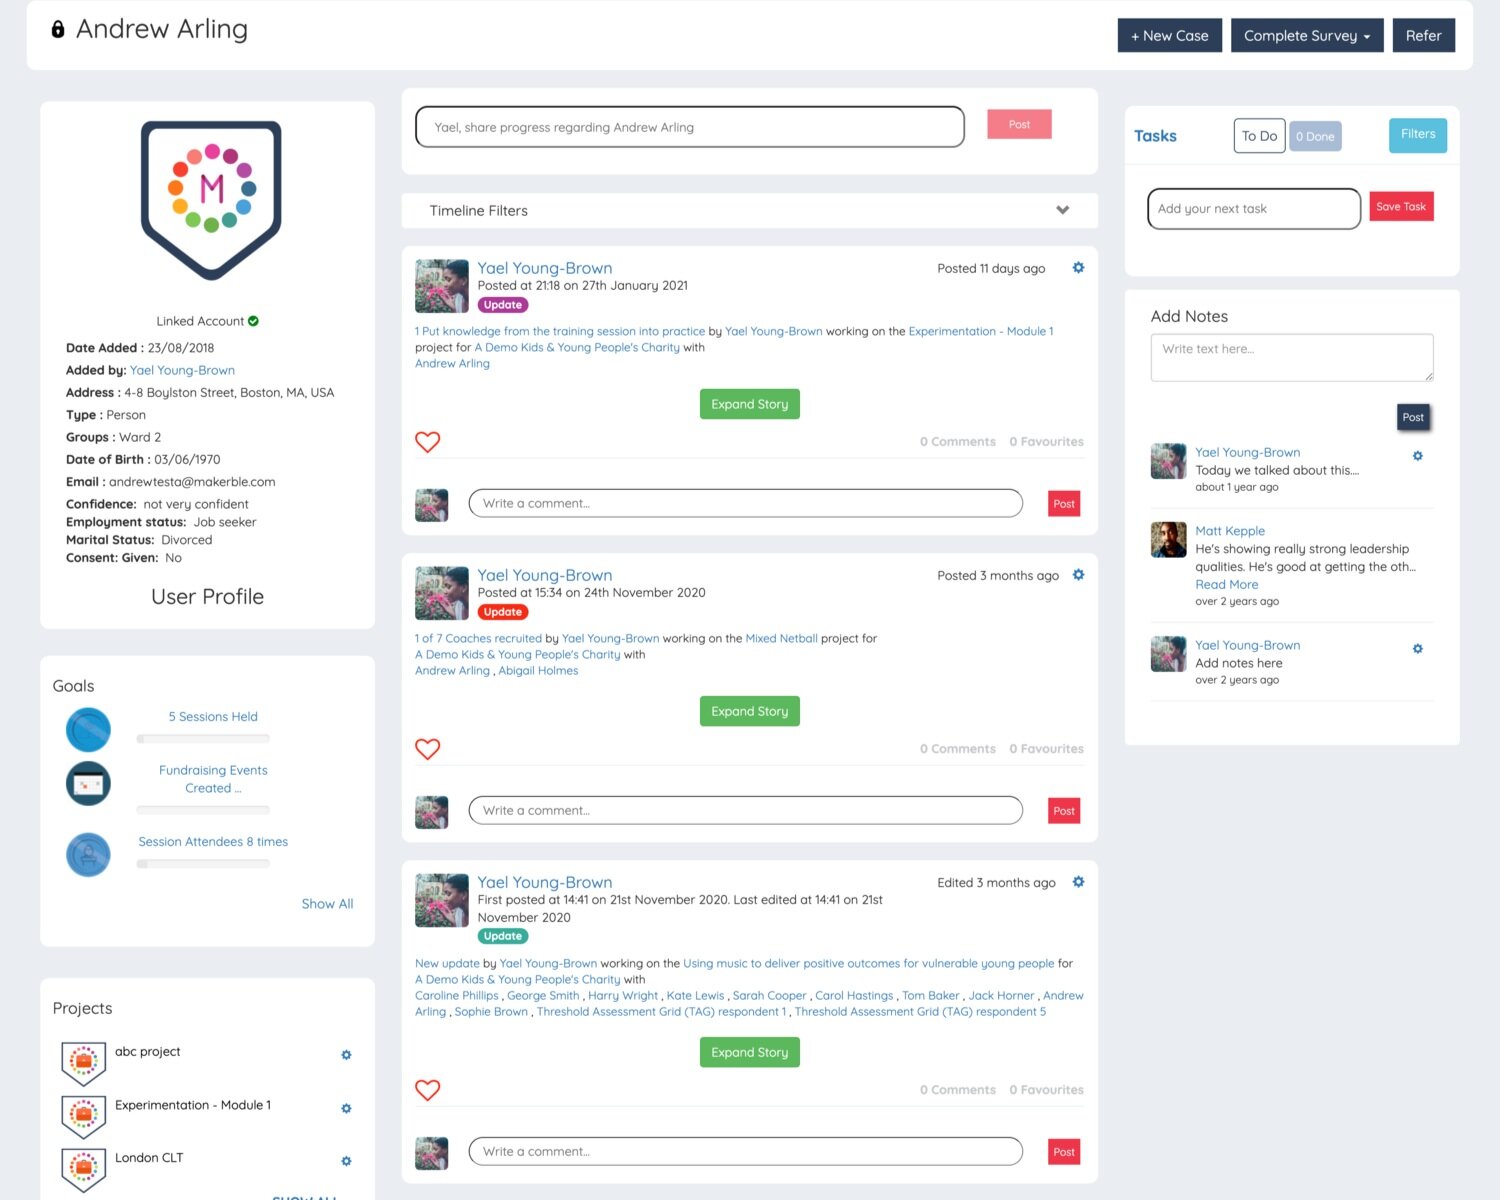
Easy to use reporting.
This is the key to not only reporting on your impact, but also encouraging people in their data collection too. Because when an individual can SEE the difference they are making, at a glance, data input becomes a lot more motivating. What if they could set their beneficaries, or clients, goals and then see how close they were to achieving them, in real time? They’re more likely to input that data in the first place.
Tracking goals and capturing data is made easy with Makerble
Pretty charts and dashboards
Now the team are motivated to collect that data- how do you report on it? With traditional systems you may be used to downloading it all and analysing it in Excel. What if you could have dashboards that tracked all of your progress? You can look at data in real time and realise wow, “I didn’t realise we were helping that many people.” “It’s interesting that we’ve seen a drop off in attendance recently, I wonder why that may be” and so much more.
That’s why we’re here.
Our ethos is to help you Learn, Adpat and Repeat. We want data collection to feel easy, reporting like a breeze. Not just so you can report to your funders and stakeholders (although our customisable public dashboards means you can share your stats with them instanly-no, seriously) but so you can use your data to make changes, adapt your services and therefore have a greater impact.
We’d love to chat
We’re so passionate about this and we’d love to hear more about you and the current challenges you face around this. So, if you’re interested in hearing more, you can book in a chat with one of us today.